


A study of different cases of VVER reactor core flooding in a large break loss of coolant accident
41
lượt xem 2
download
lượt xem 2
download
 Download
Vui lòng tải xuống để xem tài liệu đầy đủ
Download
Vui lòng tải xuống để xem tài liệu đầy đủ
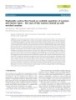
The paper covers the results of VVER core reflooding studies in fuel assembly (FA) mockup of 126 fuel rod simulators with axial power peaking. The experiments were performed for two types of flooding. The first type is top flooding of the empty (steamed) FA mockup.
Chủ đề:
Bình luận(0) Đăng nhập để gửi bình luận!
Lưu
CÓ THỂ BẠN MUỐN DOWNLOAD


TRỢ GIÚP
HỖ TRỢ KHÁCH HÀNG
Theo dõi chúng tôi


Chịu trách nhiệm nội dung:
Nguyễn Công Hà - Giám đốc Công ty TNHH TÀI LIỆU TRỰC TUYẾN VI NA
LIÊN HỆ
Địa chỉ: P402, 54A Nơ Trang Long, Phường 14, Q.Bình Thạnh, TP.HCM
Hotline: 093 303 0098
Email: support@tailieu.vn
Giấy phép Mạng Xã Hội số: 670/GP-BTTTT cấp ngày 30/11/2015 Copyright © 2022-2032 TaiLieu.VN. All rights reserved.

