


Accounting undergraduate Honors theses: Essays on monetary policy rules and inflation dynamics
lượt xem 3
download
 Download
Vui lòng tải xuống để xem tài liệu đầy đủ
Download
Vui lòng tải xuống để xem tài liệu đầy đủ
My aim in accounting for potential nonlinearity is to get a better understanding of the policy makers’ opportunistic approach to monetary policy and evaluate the inflation globalization hypothesis, which basically predicts that global factors will eventually replace the domestic determinants of inflation.
Bình luận(0) Đăng nhập để gửi bình luận!
Nội dung Text: Accounting undergraduate Honors theses: Essays on monetary policy rules and inflation dynamics
- University of Arkansas, Fayetteville ScholarWorks@UARK Theses and Dissertations 8-2016 Essays on Monetary Policy Rules and Inflation Dynamics Saad Ahmad University of Arkansas, Fayetteville Follow this and additional works at: http://scholarworks.uark.edu/etd Part of the Macroeconomics Commons Recommended Citation Ahmad, Saad, "Essays on Monetary Policy Rules and Inflation Dynamics" (2016). Theses and Dissertations. 1635. http://scholarworks.uark.edu/etd/1635 This Dissertation is brought to you for free and open access by ScholarWorks@UARK. It has been accepted for inclusion in Theses and Dissertations by an authorized administrator of ScholarWorks@UARK. For more information, please contact scholar@uark.edu, ccmiddle@uark.edu.
- Abstract There has been a growing trend to utilize nonlinear models to analyze key issues in mon- etary policy and international macroeconomics. Using traditional linear models to under- stand nonlinear relationships can often lead to inaccurate inference and erroneous policy recommendations. The three essays in this dissertation explore nonlinearity in the Federal Reserve’s policy response as well as between a country’s inflation dynamics and integration in the global economy. My aim in accounting for potential nonlinearity is to get a better understanding of the policy makers’ opportunistic approach to monetary policy and evalu- ate the inflation globalization hypothesis, which basically predicts that global factors will eventually replace the domestic determinants of inflation. In the first essay I develop a broad nonlinear Taylor rule framework, in conjunction with real- time data, to examine the Fed’s policy response during the Great Moderation. My flexible framework is also able to convincingly show that the Fed departed from the Taylor rule during key periods in the Great Moderation as well as in the recent financial crisis. The second essay uses a threshold methodology to investigate the importance of nonlinear effects in the analysis of the inflation globalization hypothesis. Finally the third essay investigates the relationship between inflation and globalization, under an open-economy Phillips Curve framework, for a panel of OECD countries with a dynamic panel GMM methodology. Contrary to most of the previous literature, which ignores such nonlinearities, my new approach provides some interesting empirical evidence supportive of the effect globalization has on a country’s inflation dynamics.
- Acknowledgements I am deeply grateful to my dissertation committee chair, Andrea Civelli, for his continued guidance and support during my graduate studies. I owe profound thanks to my committee members, Jingping Gu and Tim Yeager, who helped improve my work and increased my research capabilities. Lastly, this dissertation and my academic studies would not be possible without the constant support and belief of my parents, Ahmad and Nausheen.
- 1 Introduction There has been a growing trend to utilize nonlinear models to analyze key issues in mone- tary policy and international macroeconomics. Using traditional linear models to understand nonlinear relationships can often lead to inaccurate inference and erroneous policy recommen- dations. The three essays in this dissertation explore nonlinearity in the Federal Reserve’s policy response as well as between a country’s inflation dynamics and integration in the global economy. My aim in accounting for potential nonlinearity is to get a better under- standing of the policy makers’ opportunistic approach to monetary policy and evaluate the inflation globalization hypothesis, which basically predicts that global factors will eventually replace the domestic determinants of inflation. The validity of the inflation globalization hypothesis could eventually lead to prominent changes in the conduct of monetary policy, so it is imperative to identify the exact role global forces play in the inflation process. In the first essay, A multiple threshold analysis of the Fed’s balancing act during the Great Moderation, I develop a broad nonlinear Taylor rule framework, in conjunction with real- time data, to examine the Fed’s policy response during the Great Moderation. My analysis finds that standard two-regime smooth transition models are unable to fully capture the Fed’s nonlinear response. I therefore utilize the Multiple Regime Smooth Transition model (MRSTAR) to get a better understanding of the Fed’s asymmetric preferences and oppor- tunistic conduct of monetary policy. With the MRSTAR model I am able to use both inflation and the output gap as concurrent threshold variables in the Fed’s policy response function and am able to determine that policy makers prioritize loss of output over infla- tionary concerns. My flexible nonlinear framework is also able to convincingly show that the Fed departed from the Taylor rule during key periods in the Great Moderation as well as in the recent financial crisis. 1
- The second essay, Globalization and inflation: A threshold investigation, uses a threshold methodology to investigate the importance of nonlinear effects in the analysis of the inflation globalization hypothesis. Accounting for potential nonlinearities in the Phillips Curve, I show that trade openness is not rejected as a threshold variable for the effects of domestic and foreign slack on inflation in many advanced economies, and also find a switch of the output gap slopes from one regime to the other that is consistent with the key predictions of the inflation globalization hypothesis. For some countries the threshold Phillips Curve model also leads to improvements in out-of-sample forecasts over the linear Phillips models, especially at longer horizons. Contrary to most of the previous literature, which ignores such nonlinearities, my new approach provides some interesting empirical evidence supportive of the effect globalization has on a country’s inflation dynamics. Finally the third essay, A dynamic panel threshold analysis of the inflation globalization hypothesis, investigates the relationship between inflation and globalization, under an open- economy Phillips Curve framework, for a panel of OECD countries with a dynamic panel GMM methodology. Previous studies on the inflation globalization hypothesis have exam- ined this question primarily at the individual-country level. However, a panel approach seems quite appropriate as globalization measures, such as trade openness, often exhibit considerable cross-sectional variation. Using this framework, I find strong evidence in favor of including global factors, as captured by the foreign output gap, in a country’s inflation process. I further augment the dynamic panel model with a threshold component and show that trade openness acts as a threshold variable for the effects of domestic and foreign slack on inflation. Importantly, the switch in the output gap slopes from one regime to the other is consistent with the key predictions of the inflation globalization hypothesis, so that in more open economies the foreign output gap replaces the domestic output gap as the key determinant in the country’s domestic inflation process. 2
- 2 Chapter 1 A multiple threshold analysis of the Fed’s balancing act during the Great Moderation Abstract Empirical evidence has generally shown that the Fed follows close to a Taylor rule in setting policy rates. This paper continues this line of inquiry by developing a broad nonlinear Taylor rule framework, in conjunction with real-time data, to examine the Fed’s policy response during the Great Moderation. Our analysis finds that standard two-regime smooth transition models are unable to fully capture the Fed’s nonlinear response. Thus we utilize the multiple-regime smooth transition model (MRSTAR) to get a better understanding of the Fed’s asymmetric preferences and opportunistic conduct of monetary policy. With the MRSTAR model we can use both inflation and the output gap as concurrent threshold variables in the Fed’s policy response function and are able to determine that policy makers prioritize loss of output over inflationary concerns. Our flexible nonlinear framework is also able to convincingly show that the Fed departed from the Taylor rule during key periods in the Great Moderation as well as in the recent financial crisis. 3
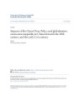
- 2.1 Introduction For over 20 years the Taylor rule (Taylor, 1993) has been used to both shape and evaluate the central bank’s policy actions. An important feature of the rule was that it allowed the nominal policy rate to respond to both inflation and the output gap, reflecting the twin concerns of monetary authorities. While Taylor intended his rule to be normative, the fact that it was also a good match with the Fed’s interest-rate setting behavior increased its appeal as a tool to conduct historical policy analysis (Asso and Leeson, 2012). Figure 1 plots the recommended rates from the Taylor rule alongside the historical Fed Funds rate and we continue to see the Fed generally being close to the Taylor rule when setting the policy rates. In the course of time, a few modifications have been further made to the original Taylor rule to better fit the Fed’s policy response. First there is strong indication that policy makers are forward-looking so that expectations of inflation and the output gap play a greater role than current or lagged values in setting interest rates (Clarida et al., 2000). An interest-rate smoothing term was also added because in practice the Fed prefers to change its policy rate gradually to account for the uncertainty in its economic models (Blinder and Reis, 2005). Moreover, a focus was put on looking at the real-time data that is actually available to the policy makers at the time of their decision (Orphanides, 2001). Finally, the possibility of the Fed’s policy rule being nonlinear has also been examined (Kim et al., 2005 and Hayat and Mishra, 2010). We continue this line of inquiry by developing a broad nonlinear Taylor rule framework to examine the Fed’s policy response during the Great Moderation, an era in which the U.S. economy experienced low output volatility and relatively mild inflation (Ahmed et al., 2004). Purported changes in the Fed’s conduct of monetary policy and the role they played in the 4
- 12 11 TAYLOR_FED FED FUNDS 10 9 8 7 6 5 4 3 2 1 0 84 85 86 87 88 89 90 91 92 93 94 95 96 97 98 99 00 01 02 03 04 05 06 07 Figure 1: Actual Fed Funds rate and the rates under the classic Taylor Rule (Taylor, 1993). Great Moderation have been especially analyzed and debated.1 Boivin and Giannoni (2006) show that the Fed, by being more responsive to inflation, was able to significantly reduce the volatility of both U.S. output and inflation levels.2 Bernanke (2012) further contends that the Fed also helped increase economic stability by reducing the potency of exogenous shocks. Our goal then is to compare a broad set of non-linear reponse functions, in conjunction with real-time data, to get a better understanding of how the Fed successfully balanced its dual- mandate during this significant economic period. We can then determine if the improved monetary performance was indeed driven by a greater emphasis on policy rules as suggested by Taylor (2012). While it is understandable that much of the recent focus has been on the Fed’s unconventional response following the financial crisis, historical analysis is still valuable as long as we can clearly identify the policies in place when the times were good. 1 See for example Favero and Rovelli (2003), Primiceri (2005), Sims and Zha (2006), Bianchi (2013) among many others. 2 Stock and Watson (2003) determined that better monetary policy contributed up to 25% of the decline in output volatility. Improved monetary policy was also seen as a key factor in lower output volatility for the G7 countries (Summers, 2005). 5
- Our nonlinear analysis is based on the Smooth Transition Autoregressive (STAR) method- ology (Teräsvirta, 1994), which provides a flexible framework to test whether the Fed has asymmetric preferences and whether it conducts policy in an opportunistic manner. By al- lowing for a smooth transition between regimes, the STAR models make it easier to identify gradual policy changes and so have been a popular choice to capture nonlinear monetary policy response functions. However one concern with the current empirical literature is the reliance of only one threshold variable to generate the nonlinearity such as inflation as in Martin and Milas, 2010 and Lamarche and Koustasy, 2012, output as in Alcidi et al. (2011) and Kazanas et al. (2011) or some other macroeconomic variable like financial stress as in Gnabo and Moccero (2013). Such a modelling approach forces one factor to be com- pletely responsible for the observed nonlinearity in the policy response function. In order to overcome this limitation, we also employ the Multiple Regime STAR (MRSTAR) model as proposed by Dijk and Franses (1999) in our nonlinear analysis. Thus an important con- tribution of our empirical strategy is that with the MRSTAR model both inflation and the output gap are able to act as simultaneous thresholds in the Fed’s response function. With four distinct regimes, the MRSTAR model is able to give a more complete overview of the various economic scenarios and contingencies the Fed faces when setting the policy rate and so represents a better tool for understanding key policy decisions. Using the STAR methodology, we estimate Taylor rules with real-time data for the years 1983-2007. Our first nonlinear Taylor model has a Logistic STAR1 specification in which the Fed’s forecast for the output gap acts as the threshold variable responsible for the regime switch.3 In the Normal regime (output gap greater than −1.66%) the Fed’s response is in line with the Taylor rule with an inflation coefficient greater than 1 and a positive output gap coefficient. However, the Taylor rule fails to capture the drastic drop in the Fed Funds 3 A monetary policy regime switch is said to occur only if there is a systematic change in the policy response. 6
- Rate seen in the Distressed regime (output gap lower than −1.66%). Notably, the Distressed regime corresponds to periods with strong economic shocks such as the Savings and Loans crisis in 1987, the recession in the early 90s and the dot-com crash in the 2000. We then estimate a Logistic STAR2 model in which the forecast of inflation acts as the threshold variable. We find that while the Fed does have a strong response to inflation in the Outer regime (inflation either below 1.6% or above 3.1%), it reacts only to the output gap in the Inner regime (inflation between 1.6% and 3.1%). So we continue to see evidence of the Fed being opportunistic in trying to achieve its inflation objective (Orphanides and Wilcox, 2002). Extensive misspecification tests reveal that nonlinearity remains unmapped by these Logistic STAR models. We then turn toward the MRSTAR model, which combines the separate regimes of the LSTAR1 and LSTAR2 specifications and so allows the Fed to have a different response in each of these economic regimes. We find that the Fed follows the Taylor rule only in the Normal & Outer regime of the MRSTAR model. In the Normal & Inner regime the Fed has a very passive response, while in the Distressed & Outer and Distressed & Inner regime the Fed’s response to inflation is less than 1 and so in clear violation of the Taylor Principle. These findings clearly show that the Fed did depart from the Taylor rule for key periods in the Great Moderation. From these estimated responses we can also determine that the Fed prioritizes a loss of output over inflationary concerns, and thus propose a loss function that can account for such asymmetric preferences. Finally we also show that the MRSTAR model can be used to examine the Fed’s response during the financial crisis. The rest of the paper is organized as follows. Section 2.2 reviews the literature on nonlinear Taylor rules. Section 2.3 describes the real-time data sources. Section 2.4 gives the empirical methodology and the Taylor rule specifications. Section 2.5 discusses the main findings while Section 2.6 concludes. 7
- 2.2 Literature Review Widespread policy failures in the 1970s pushed the Fed and other central banks to undergo significant institutional reforms so that monetary policy could be conducted in a more sys- tematic and transparent manner (Issing, 2008). Policy rules in this environment became particularly attractive as a means to codify the decision making process (Poole, 1999). The simplicity of the Taylor rule along with its emphasis on short-term interest rates enabled it to quickly gain traction with central bankers (Kahn, 2012). The classic Taylor rule can be expressed as it = r∗ + πt + ζ π (πt − π ∗ ) + ζy yt (1) where it stands for the policy rate in the period t, r∗ is the long run real equilibrium interest rate, πt and π ∗ represent the current and target rates of inflation, and yt is the output gap. Taylor suggested the value of 0.5 for both the response parameters while r∗ and π ∗ were set at 2%. Notably the Taylor rule with these parameter values ensures that the central bank changes the nominal interest rates by more than one-for-one to any deviations of inflation from the target. This has been referred to as the Taylor Principle and is seen as a way for central banks to keep inflation low and stable in the long run (Walsh, 2006). Clarida et al. (2000) showed that a linear Taylor-type rule is in fact an optimal policy response in a dynamic New Keynesian model with sticky prices. However, a key requirement is for central banks to have a quadratic loss function so that they give equal weight to positive and negative deviations of inflation and the output gap from their intended targets. Policy observors considered this loss function unrealistic, leading them to an examination of asymmetric preferences for policy makers. Cukierman and Gerlach (2003) suggested 8
- a piecewise quadratic loss function such that policy makers have the standard quadratic specification when the output gap is negative but focus only on inflation when the output gap is positive (actual output greater than potential). A more general specification for such a loss function is given in Bec et al. (2002) as 1n o 1n o L(πt , yt ) = (πt − π ∗ )2 + we yt2 I[yt >0] + (πt − π ∗ )2 + wr yt2 I[yt
- regime to another. If the regime switch depends on the value of some observed economic variable, then we can apply threshold models such as the Threshold Autoregresive (TAR) model or the STAR model. Alternatively the regime switch can occur due to an unobserved state variable and modeled as a Markov Switching (MS) process (Bae et al., 2012). While this approach requires fewer prior assumptions for the switch and so is more data driven, it also makes it harder to infer the exact economic circumstances that are generating the nonlinear response.6 Given that central banks often have clear policy objectives, it is highly likely that shifts in the policy response are a direct reaction to observed changes in economic conditions. The STAR model is also convenient for modelling gradual changes in responses as policy makers are generally wary of abrupt policy changes as it can lead to higher volatil- ity in financial markets and cause the public to lose confidence in the central bank’s ability to manage the economy (Blinder and Reis, 2005). Thus in our analysis, we will employ the STAR methodology to determine if the Fed’s monetary policy changed in response to key macreconomic variables during the Great Moderation.7 A limitation with both TAR and STAR models is that they rely on only one threshold variable to generate the nonlinearity. In the context of monetary policy analysis, this often leads one economic factor to be completely responsible for the central bank’s nonlinear response function. Indeed Kim et al. (2005) have shown that in the case of the Fed, the nonlinearity is best captured when the interaction of the output gap and inflation is included in the standard Taylor rule specification. Thus we also consider the more flexible MRSTAR model and in doing so allow both inflation and the output gap to act as concurrent threshold variables in the Fed’s response function. 6 This is also an issue in the context of Time-Varying Parameter models that have been also used to identify the central bank’s nonlinear response. See Boivin (2005) and Kim and Nelson (2006) for examples of this empirical framework. 7 Gregoriou and Kontonikas (2009) have also shown that the STAR model outperforms the Markov Switching model in out-of-sample interest rate forecasts for key OECD countries. 10
- To our knowledge, Bunzel and Enders (2010) is the only other work that also allows both inflation and the output gap to have nonlinear effects on the Fed’s policy response. However there are three strong differences as it relates to the empirical analysis in this paper. First, even when they consider both inflation and output gap as thresholds, it is still in the context of a traditional two-regime model. Thus in their framework the Fed can only be policy active if there is either a negative output gap or if inflation is above an interim target πt∗ (the average inflation rate in the last two years) and so forces the same policy response in periods with high inflation as in periods of recession.8 Second, their Taylor rule specifications are based on the current horizon and so are unable to capture the forward-looking behavior of policy makers as we do with our models using the Fed’s own real-time forecasts as inputs. Finally they use the TAR framework in their analysis which, unlike the STAR models, is only able to identify sharp changes in policy. Within the STAR framework we are also able to use the non-linearity specification tests, as described in Dijk and Frances (1999), to explicitly determine if the STAR model is adequate to capture the non-linear response. Such a feature is missing in standard TAR analysis of monetary policy rules. 2.3 Data The Great Moderation is generally considered to have begun sometime in the early to middle ’80s (Summers, 2005). Thus our analysis for this era is based on U.S. quarterly data for the periods 1983:Q3 to 2007:Q4. We use 1983:Q3 as our starting range as it comes after the sustained disinflation push that had been adopted by the Volcker Fed. Further, early in the Volcker era there was a greater focus on monetary aggregates and so the Taylor rule applied to such monetary regimes can often lead to misleading analysis (Sims and Zha, 8 It is also a little unclear if the threshold values in these ’opportunistic’ Taylor rule models are actually based on grid search estimates or are taken as ad hoc, yet reasonable conjecture of when policy makers should be reacting to output and inflation. 11
- 2006). Ending at 2007:Q4 avoids the financial crisis, during which the Fed took a number of unconventional monetary measures (Cecchetti, 2009) that can be difficult to analyze in a Taylor rule framework. In much of the early literature the empirical analysis on Taylor rules was done using expost data that had generally undergone significant revisions. Orphanides (2001) contends that it’s better to use the real-time data that was actually available to policy makers because Taylor rule prescriptions can vary substantially depending on the type of data that is used in the analysis. Thus we rely only on real-time data sources. Our first source of real-time data comes from the Greenbooks that the Fed staff specifically prepared for the FOMC meetings. The Greenbooks contain the Fed’s latest information on previous output and inflation levels as well as projected forecasts for different time horizons. In our analysis, we will be using primarily the GDP deflator as the measure of the price level so that the forecasts of inflation are just the Greenbook-projected quarter-over-quarter (annualized) changes in the GDP deflator. Since the policy rate is not revised we just use the annualized effective Fed Funds rate series from the St. Louis Fed (FRED) database.9 We also use the data set at the Federal Reserve of Philadelphia as another source of real-time data. Croushore and Stark (2001) have created data vintages for key macroeconomic series where a vintage is defined as the data that is actually available in a particular quarter. Each vintage incorporates revisions to earlier observations, so we can obtain the real-time values of real GDP and the GDP deflator. A quadratic detrend is then applied on the real GDP series to get the real-time output gap estimates for this data source.10 We will be using this data as a robustness check for the Taylor rules estimated with the Greenbook forecasts. 9 Unit root tests provided in Appendix A and little evidence of any non-stationary process. 10 Note per Orphanides and Van Norden (2002), real-time output gaps constructed by detrending are not reliable estimates of the actual output gap for a given period and so are used only to gauge the pressures policy makers were facing in real-time. 12
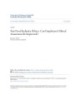
- Figures 2 and 3 plot the output gap and inflation from the real-time data sources. To ease comparison we also include the expost series using the most recent revised data available. As can be seen the output gap forecast series from the Fed Greenbook (fgap) is closer to the revised series (exgap) than the detrended real-time output series (rgap). Nevertheless the forecasts of the output gap do diverge from the revised series notably in recessions and will result in different estimates of the Taylor rule (Molodtsova et al., 2008). 8 Expost Real-time 6 Greenbook 4 2 0 -2 -4 -6 -8 -10 84 85 86 87 88 89 90 91 92 93 94 95 96 97 98 99 00 01 02 03 04 05 06 07 Figure 2: US output gap estimates based on either expost, real-time or Greenbook data. 5.5 Expost 5.0 Real-time Greenbook 4.5 4.0 3.5 3.0 2.5 2.0 1.5 1.0 0.5 84 85 86 87 88 89 90 91 92 93 94 95 96 97 98 99 00 01 02 03 04 05 06 07 Figure 3: US inflation estimates (the year to year change in the GDP deflator)using either expost, real-time or Greenbook data. 13
- 2.4 Empirical Strategy An advantage of Greenbook forecast data is that forward-looking Taylor rules can be easily estimated without any instrument variable.11 Since our nonlinear analyis is based on the STAR model, we next give a brief overview of its modelling framework.12 2.4.1 STAR Methodology The STAR model was developed as an extension of the traditional TAR models with the idea that there was a smooth transition between regimes. This feature makes the STAR conve- nient for modelling economic environments that undergo gradual changes. For a univariate time series yt a STAR model can be specified as: yt = θ1 xt (1 − G(st ; γ, c)) + θ2 xt G(st ; γ, c) + εt (3) 0 0 where xt = (yt−1 , ...yt−p , z1t , ...zkt ) contains both lagged terms and other explanatory vari- ables. The error term εt is a Martingale Difference Sequence with constant conditional variance. The transition function G(.) is a continuous function that is bounded between 0 and 1 while st acts as the transition variable. So the STAR can be considered a regime- switching model where regimes are represented by the extreme points of G(.) and there is a smooth transition from one regime to the other. The choice of the transition function G(.) plays an important role in determining the regime- 11 These forecasts are assumed to be uncorrelated with current policy shocks (Boivin, 2006). 12 This discussion borrows from Dijk et al. (2002) and Teräsvirta et al. (2010). 14
CÓ THỂ BẠN MUỐN DOWNLOAD

-
Accounting undergraduate Honors theses: New business initiatives and financial performance
 232 p |
  25
|
25
|  4
4
-
Accounting undergraduate Honors theses: Essays on the economics of child care and child custody
127 p | 20
| 3
-
Accounting undergraduate Honors theses: Path to higher education
32 p | 33
| 3
-

Accounting undergraduate Honors theses: The influence of nonpublic audit concentration on public client audit outcomes
75 p | 31
| 3
-

Accounting undergraduate Honors theses: Lobbying activity in the standards setting process - Fasb statement on financial accounting standards no. 106, "employers accounting for postretirement benefits other than pensions
132 p | 21
| 3
-
Accounting undergraduate Honors theses:The effect of CEO IT expertise on the information environment - Evidence from management earnings forecasts
92 p | 30
| 3
-
Accounting undergraduate Honors theses: Essays in economic growth and development
105 p | 43
| 3
-
Accounting undergraduate Honors theses: Essays on international trade and finance
139 p | 45
| 3
-
Accounting undergraduate Honors theses: Essays on the changing nature of business cycle fluctuations - A state level study of jobless recoveries and the great moderation
131 p | 29
| 3
-
Accounting undergraduate Honors theses: Do changes in the SG&A ratio provide information about changes in future earnings, analyst forecast revisions, and stock returns
99 p | 21
| 3
-

Accounting undergraduate Honors theses: A brighter future - The impact of charter school attendance on student achievement in little rock
27 p | 37
| 2
-
Accounting undergraduate Honors theses: One mans dream - how a company
52 p | 23
| 2
-

Accounting undergraduate Honors theses: History and analysis of the fayetteville, Arkansas human civil rights ordinance
114 p | 19
| 2
-

Accounting undergraduate Honors theses: Are prize linked savings accounts the solution to Arkansas?
21 p | 28
| 2
-
Accounting undergraduate Honors theses: Impacts of the open door policy and globalization on income inequality inChina between the 20th century and the early 21st century
26 p | 33
| 1
-
Accounting undergraduate Honors theses: Fast food industry ethics - Can employee
49 p | 30
| 1
-

Accounting undergraduate Honors theses: It's a business: A financial analysis of the BCS system and its alternatives
13 p | 24
| 0


Chịu trách nhiệm nội dung:
Nguyễn Công Hà - Giám đốc Công ty TNHH TÀI LIỆU TRỰC TUYẾN VI NA
LIÊN HỆ
Địa chỉ: P402, 54A Nơ Trang Long, Phường 14, Q.Bình Thạnh, TP.HCM
Hotline: 093 303 0098
Email: support@tailieu.vn
Giấy phép Mạng Xã Hội số: 670/GP-BTTTT cấp ngày 30/11/2015 Copyright © 2022-2032 TaiLieu.VN. All rights reserved.

