


Báo cáo hóa học: " Atomic characterization of Si nanoclusters embedded in SiO2 by atom probe tomography"
lượt xem 6
download
 Download
Vui lòng tải xuống để xem tài liệu đầy đủ
Download
Vui lòng tải xuống để xem tài liệu đầy đủ
Tuyển tập báo cáo các nghiên cứu khoa học quốc tế ngành hóa học dành cho các bạn yêu hóa học tham khảo đề tài: Atomic characterization of Si nanoclusters embedded in SiO2 by atom probe tomography
Bình luận(0) Đăng nhập để gửi bình luận!
Nội dung Text: Báo cáo hóa học: " Atomic characterization of Si nanoclusters embedded in SiO2 by atom probe tomography"
- Roussel et al. Nanoscale Research Letters 2011, 6:164 http://www.nanoscalereslett.com/content/6/1/164 NANO EXPRESS Open Access Atomic characterization of Si nanoclusters embedded in SiO2 by atom probe tomography Manuel Roussel1*, Etienne Talbot1, Fabrice Gourbilleau2, Philippe Pareige1 Abstract Silicon nanoclusters are of prime interest for new generation of optoelectronic and microelectronics components. Physical properties (light emission, carrier storage...) of systems using such nanoclusters are strongly dependent on nanostructural characteristics. These characteristics (size, composition, distribution, and interface nature) are until now obtained using conventional high-resolution analytic methods, such as high-resolution transmission electron microscopy, EFTEM, or EELS. In this article, a complementary technique, the atom probe tomography, was used for studying a multilayer (ML) system containing silicon clusters. Such a technique and its analysis give information on the structure at the atomic level and allow obtaining complementary information with respect to other techniques. A description of the different steps for such analysis: sample preparation, atom probe analysis, and data treatment are detailed. An atomic scale description of the Si nanoclusters/SiO2 ML will be fully described. This system is composed of 3.8-nm-thick SiO layers and 4-nm-thick SiO2 layers annealed 1 h at 900°C. Introduction controlling the major structural characteristics of the nanoclusters (size, composition, distribution and inter- Since the discovery of photoluminescence of porous sili- face nature) for the achievement of the optimized opti- con by Canham in 1990 [1], nanostructured silicon sys- cal properties of the device. Consequently, SRSO/SiO2 tems have been extensively studied. Indeed, it exhibits properties (light emission, carrier storage, quantum con- ML is a structure which has been intensively experimen- finement...) which lead to plenty of potential applica- tally studied to quantify the correlation between Si-nc tions (photovoltaic cells, light amplifiers, nanoscale size and Si-nc properties [15-20]. However, conventional memory devices...) compatible with silicon integration techniques suffer from drawbacks which prevent an technology [2-5]. Silicon nanoclusters (Si-nc) embedded accurate determination of the structure in these Si/SiO2 in silica matrix is commonly considered as one of the systems. Photoluminescence is one of the most usually most promising of these systems [6-9]. used technique for such systems. Yet, it provides infor- Si-ncs are usually produced by annealing silicon-rich mation only on the optical properties of Si-nc but no silicon oxide (SRSO) to precipitate Si clusters in a silica direct information about structural characteristics [21]. matrix [10,11]. This SRSO can be obtained by different High-resolution transmission electron microscopy processes, such as ion implantation [12] or atomic (HRTEM) for instance is not able to give satisfactory deposition processes like chemical vapor deposition [13] information about the composition of a particle and its and magnetron sputtering [14]. An efficient way to surrounding chemistry and on the size distribution synthesize size-controlled Si-nc consists in sandwiching because misoriented and amorphous particles are a SRSO layer between two SiO2 layers that prevent the excluded from the high-resolution image [21,22]. Most of the recent studies report the use of EFTEM to mea- excess of silicon from diffusing outside the SRSO film. sure the size distribution of Si-nc [23-25]. As mentioned Such a multilayer (ML) structure limits the Si-nc growth by Schamm et al., such size distribution measurements either during the growth or during the final step of are based on the deconvolution of Si peak on EELS annealing [15]. This fabrication process allows for spectra. Besides, it gives only access to planar projection of three-dimensional (3D) objects, and Si-nc size * Correspondence: manuel.roussel@etu.univ-rouen.fr 1 Groupe de Physique des Matériaux, Université et INSA de Rouen, UMR strongly depends on data treatment and contrast CNRS 6634, Av. de l’université, BP 12, 76801 Saint Etienne du Rouvray, France enhancement. In addition, small clusters cannot be Full list of author information is available at the end of the article © 2011 Roussel et al; licensee Springer. This is an Open Access article distributed under the terms of the Creative Commons Attribution License (http://creativecommons.org/licenses/by/2.0), which permits unrestricted use, distribution, and reproduction in any medium, provided the original work is properly cited.
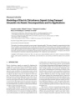
- Roussel et al. Nanoscale Research Letters 2011, 6:164 Page 2 of 8 http://www.nanoscalereslett.com/content/6/1/164 created at the apex of the tip (several V nm-1). Surface d etected. These considerations lead to uncertainty as regards size distribution. Phase composition can also be atoms are evaporated by means of electric pulses V p extrapolated from EELS spectra. However, composition added to the DC voltage V0 and are collected on a posi- can only be determined under given assumptions like tion sensitive detector. The time of flight of each evapo- monodisperse Si-nc [24]. Finally, electron tomography rated ion between the electric pulse and the impact on has been performed by Yurtsever et al. [26]. This techni- the detector is measured. This measurement permits que provides a 3D distribution of Si-nc. However, it calculating the mass-to-charge ratio: does not allow quantitative composition measurements m 2eL2 and can be tricky when it comes to small object (less 2 V0 V p (1) than 1-2 nm). As the optical and electrical properties of n t nanocrystals are strongly dependent on these character- where m is the mass of the evaporated ion (in kg), n istics, a good understanding of phase separation and dif- its electronic charge, L the distance between the tip and fusion mechanisms will allow proposing a modeling of the detector (in m), and t the time of flight of the ion the growth and thus to improve the elaboration process (in s). This calculation permits identifying the chemical at low cost. In order to achieve new information that nature of evaporated ions. The use of some geometrical complete or support the published one, atom probe arguments and knowledge of the position of the impact tomography (APT) was performed in order to study the of an ion on the detector permit calculating its position microstructure of SRSO/SiO 2 MLs. This technique is on the specimen, before the evaporation. These data able to provide a 3D chemical map of the sample at an enable the 3D reconstruction of the sample at the atomic scale, allowing a very accurate and direct charac- atomic scale. So far, the APT technique was restricted terization of Si-nc in SiO2. to metallic materials, but the recent implementation of femtosecond lasers permits the analysis of semi-conduc- Experimental tors and dielectric materials. Instead of electric pulses, SRSO/SiO2 MLs elaboration the ionization and the field evaporation of the surface SRSO/SiO2 MLs are synthesized by reactive magnetron sputtering. SiO2 pure targets are sputtered on 2” [100]- atoms are triggered by the superposition of laser pulses. In this case, UV (343 nm) femtosecond laser pulses (50 oriented wafer. Silica layers are deposited under pure nJ, 350 fs, 100 kHz) were used. In this study, APT ana- argon plasma. As hydrogen has the ability to reduce lyses are carried out on a laser-assisted wide-angle oxygen, 50% H 2 + 50% Ar plasma is used to deposit tomographic atom probe (LA-WATAP) [28]. SRSO layers containing approximately 50 at.% of silicon. The thickness of each layer is tuned by the sputtering Sample preparation for APT time. After the deposition, HRTEM analysis allows for As mentioned above, APT samples need to be prepared accurately calibrating the thicknesses of SiO2 and SRSO in the form of a sharp tip. The radius of curvature of layers that are estimated to be 4 and 3.8 nm, respec- the tip must be less than 50 nm to create a high electric tively. The deposition process was fully described in a field. The sample preparation is carried out using a previous article [14]. Samples are deposited with a focused ion beam (FIB) instrument. The Ga+ ion beam power density of 1.3 W cm -2 at 650°C, and a first is able to etch samples, and nanoscaled structures can annealing treatment is realized after the deposition dur- be extracted from bulk materials. In order to prevent ing 1 h at 900°C under N 2 . These conditions have any Ga ions ’ implantation or sample degradation, a already shown their efficiency to promote phase separa- sacrificial platinum layer is deposited before every tion of the system. milling step (approximately 400 nm). This deposition is realized directly in the FIB instrument using the gas APT principle injection system. APT is a powerful 3D chemical microscope which in The three-step method which is commonly used for principle relies on the field evaporation of surface atoms obtaining a tip from the chunk state is illustrated Figure 1. of a specimen and their identification by time-of-flight The first step consists in etching a thin lamella of 2-4-μm- mass spectrometry. Since Müller et al. [27] invented the thickness in the sample (Figure 1a). Successive milling first atom probe in 1968, it has been used in materials operations are operated on the chunk to extract posts science and particularly in physical metallurgy. Before [29]. The second step consists in micromanipulating and the analysis, the specimen is prepared in the form of a mounting extracted posts on the top of a stainless steel sharp tip with a curvature radius less than 50 nm and placed under high vacuum (≈10-13 Bar), at low tempera- needle using a Pt weld (Figure 1b). During the final step, ture (80°K), at a high positive voltage (V0 ≈ 5-15 kV). the post is submitted to an annular milling. The post is located along the axis of the ion beam which owing to Under these conditions, an intense electric field is
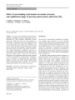
- Roussel et al. Nanoscale Research Letters 2011, 6:164 Page 3 of 8 http://www.nanoscalereslett.com/content/6/1/164 Figure 1 FIB-SEM procedure for APT sample preparation. a. Extraction of a silicon post using the Lift-out method. The sample has been milled with the help of a FIB in order to extract a strip of material. b. The strip is shaped in a post and welded onto a steel needle (platinum weld). c., d. and e. Successive annular milling steps permit to obtain a very sharp tip which curvature radius does not exceed 50nm. annular motion successively cut concentric circles of the diffraction conditions are obeyed, spherical crystalline sample. By reducing the diameter of these circles, the post clusters of silicon can be observed within the SRSO is thickened into a sharp tip with a curvature radius lower layers. Nevertheless, as noticed in former studies, only than 50 nm [30] (Figure 1c,d,e). To prevent ion beam few Si-nc are evidenced by HRTEM. Therefore, it is dif- damage and Ga implantation in the interest SRSO/SiO2 ficult to determine an accurate size distribution, parti- cle’s density, and chemical composition of the matrix/ layers, the final milling is performed at a low accelerating voltage (2 kV). As observed in previous studies, this pro- precipitate interface. This kind of information can be cess ensures Ga-free tips [31,32]. obtained by APT. Results and discussions Evidencing Si-ncs Before atom probe investigation, HRTEM images had Figure 3 shows a 3D reconstruction of the same material been realized. An example is given in Figure 2. This analyzed by LA-WATAP. In Figure 3a,b, which repre- image has been obtained on a Topcon 002B on samples sents the chemical map of Si and O atoms, each red dot prepared in a cross-sectional configuration. First, TEM corresponds to a silicon atom and each green dot corre- analysis permits estimating the thickness of SRSO and sponds to an oxygen one. The SRSO/SiO 2 stacking SiO 2 layers (3.8 and 4 nm, respectively). When sequence is clearly visible. In order to identify all the
- Roussel et al. Nanoscale Research Letters 2011, 6:164 Page 4 of 8 http://www.nanoscalereslett.com/content/6/1/164 Figure 2 HRTEM image of SiO2/SRSO layers in cross-sectional view. White circles highlight two Si-ncs. Figure 3 3D reconstruction of SRSO/SiO2 MLs of APT analysis. a. Distribution of silicon atoms in the analyzed volume. Each red dot corresponds to a silicon atom. Arrows indicate the location of SRSO layers. b. Oxygen atoms. Arrows indicate the location of SiO2 layers. c. Analyzed volume after cluster identification algorithm. Each red volume corresponds to silicon rich volumes (more than 75% of silicon) and green volumes correspond to silica composition (33% of silicon).
- Roussel et al. Nanoscale Research Letters 2011, 6:164 Page 5 of 8 http://www.nanoscalereslett.com/content/6/1/164 silicon and oxygen atoms of the matrix, causing local Si-nc (crystalline and amorphous), a cluster identifica- variation of curvature radius and trajectory aberrations. tion algorithm has been used. In this method, a sphere Because of this phenomenon, some SiO2 is artificially (1-nm radius) is placed over each atom of the volume, and the local composition is estimated by counting introduced into Si-nc during the virtual reconstruction atoms within this sphere. The 3D reconstruction atoms, of the tip. The local magnification is well known in the where the local concentration is above a given threshold APT community and can easily be corrected [34]. (75 at.% in this case), permits revealing clearly Si-rich Talbot et al. [35] have proposed and used a correction regions. A threshold of 33 at.% of Si can be used to evi- to study matrix/cluster interface in SRSO layers. dence SiO 2 regions. Figure 3c illustrates the result of this data treatment. Red volumes correspond to Si-nc Size distribution and number density of Si-nc and green ones to SiO2 matrix. Once this treatment is In such nanostructured materials, one of the most achieved, it is possible to estimate compositions of important advantages of APT analyses is to be able to phases and interface, size distribution of Si-nc, and par- accurately measure the Si-nc size. Besides, since every ticle density in the analyzed volume. precipitate is visible, it is possible to give a real size dis- tribution which takes into account both crystalline and amorphous Si-nc. To estimate a precipitate ’ s size, Si Composition information atoms within this precipitate are counted. From this APT analysis gives a chemical map of the sample and number and assuming that Si-nc are spherical (as evi- allows us to measure the composition of each phase. denced by HRTEM), it is possible to calculate the dia- These compositions can easily be estimated by counting meter for each cluster: the atoms present into phases. The composition in SiO2 layers is estimated to be 34.3 ± 0.3 at.% of Si. This mea- 3 V surement is very close to the theoretical composition of d 2 3 .n Si . Si (2) 4 SiO 2 (33.3 at.% of Si). The composition of the SRSO Q layers is estimated to be 51.0 ± 0.3 at.% of Si which is where d is the diameter of the particle (in m), nSi is very close to the composition of SRSO layers estimated the number of Si atoms in the particle, VSi is the atomic during the elaboration process. This composition corre- volume of a Si atom (in m3), and Q the efficiency of the sponds to a silicon excess of ≈26% in SiO2. The stacking detector (which is 50% in our case). The maximum sequence of silicon-rich and silica layers can be clearly error on such estimation is given by the variation of d identified on the composition profile realized along the associated to the number of Si atoms corrected from axis of the analyzed volume (Figure 4a). APT technique the local magnification effect. This error is about 0.1 nm gives a local composition at the atomic scale and allows for the smallest precipitate. Figure 5 shows a size distri- us to study the phase separation within the SRSO layers. bution of clusters realized in the analyzed volume using The annealing treatment (1 h at 900°C) realized on the this relation. samples induce the precipitation of the silicon excess. The size of the precipitates varies from 0.5 to 4.5 nm. Two phases are observed: SiO2-matrix, and Si-precipi- The mean cluster diameter is 2.9 nm. More than 50% of tates. The matrix is composed of 41.9 ± 0.3 at.% of Si. the particle sizes lies in the range of 3-4 nm which is This silicon concentration is significantly higher than in approximately the size of the SRSO sublayer (3.8 nm). pure silica. An excess of silicon is still present in the The number density of particles is deduced from the matrix evidencing an incomplete phase separation number of particle in SRSO layers over these layers ’ between Si and SiO2 after the 1-h annealing at 900°C. volume. No cluster with a size greater than the SRSO Si-nc composition can be measured with the help of layers was detected indicating that Si atoms in excess composition profiles as shown in Figure 4b. This com- diffuse only in the SRSO layers. In this case, number position profile shows the oxygen and silicon concentra- density is estimated to be 9.0 × 10¹⁸ ± 1.0 × 1018 cm-3. tions across a 4-nm-diameter Si-nc. Si-nc core This density is very close to the theoretical number den- compositions measured in this way systematically is 80 sity of particles if all Si excess form precipitates of 3.8- ± 3 at.% of Si for almost all clusters. This result is not nm-diameter with a layer thickness of 11.5 × 1018 cm-3. coherent with HRTEM observations. Indeed previous electron microscopy studies have proven that Si-nc are Conclusions pure silicon [21,22,33]. This difference is due to a well- In conclusion, APT has been used in this study to inves- known APT artifact: the local magnification effect. This tigate SRSO/SiO 2 ML containing Si-nc. We demon- effect is caused by the difference between the evapora- strated that APT is able to provide a chemical map of tion fields of Si-nc, which is significantly lower than that such systems in 3D. Such analysis, at the atomic scale, of the silica surrounding (matrix). It means that silicon allows for accurate and direct measurement of structural atoms belonging to clusters evaporate more easily than
- Roussel et al. Nanoscale Research Letters 2011, 6:164 Page 6 of 8 http://www.nanoscalereslett.com/content/6/1/164 Figure 4 Concentration profile deduced from APT experiments. a. Concentration profile along the analyzed volume; b. Concentration profile across a precipitate. Figure 5 Size distribution of Si-nc evidenced in the analyzed volume.
- Roussel et al. Nanoscale Research Letters 2011, 6:164 Page 7 of 8 http://www.nanoscalereslett.com/content/6/1/164 parameters like phase composition, size distribution, or 9. Allan G, Delerue C, Lannoo M: Nature of Luminescent Surface States of Semiconductor Nanocrystallites. Phys Rev Lett 1996, 76:2961. chemical information on individual particle. For 10. Kanemitsu Y: Photoluminescence spectrum and dynamics in oxidized instance, it was established that for a 3.8-nm-thick silicon nanocrystals: A nanoscopic disorder system. Phys Rev B 1996, SRSO containing 26% of silicon in excess, a 1 h of 53:13515. 11. Gourbilleau F, Portier X, Ternon C, Voivenel P, Madelon R, Rizk R: Si-rich/ annealing treatment at 900°C induces the precipitation SiO2 nanostructured multilayers by reactive magnetron sputtering. Appl of Si-nc with a mean diameter of 2.9 nm and a number Phys Lett 2001, 78:3058. density of 9 × 10 18 cm -3 . There remains 13% silicon 12. Guha S, Pace M, Dunn D, Singer I: Visible light emission from Si nanocrystals grown by ion implantation and subsequent annealing. Appl excess in the SRSO layer, evidencing that phase separa- Phys Lett 1997, 70:1207. tion is not complete. It can be assumed that further 13. Baron T, Mazen F, Busseret C, Souifi A, Mur P, Fournel F, Séméria M, annealing treatment will result in the precipitation of Moriceau H, Aspard B, Gentile P, Magnea N: Nucleation control of CVD growth silicon nanocrystals for quantum devices. Microelectron Eng 2002, the remaining Si excess, the increase of mean diameter, 61-62:511. and the disappearance of small precipitates. Such infor- 14. Ternon C, Gourbilleau F, Portier X, Voidevel P, Dufour C: An original mation becomes easily accessible thanks to APT techni- approach for the fabrication of Si/SiO2 multilayers using reactive magnetron sputtering. Thin Solid Films 2002, 419:5. que. Besides, such data are crucial to understand 15. Gourbilleau F, Ternon C, Maestre D, Palais O, Dufour C: Silicon-rich SiO2/ correlation between characteristics and photolumines- SiO2 multilayers: A promising material for the third generation of solar cence or electrical properties of Si-nc, as well as the cell. J Appl Phys 2009, 106:013501. 16. Iacona F, Bongiorno C, Spinella C, Boninelli S, Priolo F: Formation and modeling of the kinetic of phase separation in these evolution of luminescent Si nanoclusters produced by thermal nanostructured systems, which are beneficial for the annealing of SiOx films. J Appl Phys 2004, 95:3723. improvement of the elaboration processes. 17. Hill N, Whaley K: Size Dependence of Excitons in Silicon Nanocrystals. Phys Rev Lett 1995, 75:1130. 18. Garrido Fernandez B, Lopez M, García C, Pérez-Rodríguez A, Morante JR, Bonafos C, Carrada M, Claverie A: Influence of average size and interface Acknowledgements passivation on the spectral emission of Si nanocrystals embedded in This study was supported by the upper Normandy Research and the French SiO2. J Appl Phys 2002, 91:798. Ministry of Research in the framework of Research Networks of Upper- 19. Creazzo T, Redding B, Marchena E, Murakowski J, Prather D: Tunable Normandy. The authors also acknowledge “Le Fond Européen de photoluminescence and electroluminescence of size-controlled silicon Développement Régional” (FEDER) for his support. nanocrystals in nanocrystalline-Si/SiO2 superlattices. J Luminescence 2010, 130:631. Author details 20. Hryciw A, Meldrum A, Buchanan K, White C: Effects of particle size and 1 Groupe de Physique des Matériaux, Université et INSA de Rouen, UMR excitation spectrum on the photoluminescence of silicon nanocrystals CNRS 6634, Av. de l’université, BP 12, 76801 Saint Etienne du Rouvray, France formed by ion implantation. Nucl Instrum Methods Phys Res B 2004, 2 Centre de Recherche sur les Ions, les Matériaux et la Photonique (CIMAP), 222:469. CEA/CNRS/ENSICAEN/UCBN, 6 Bd. Maréchal Juin, 14050 Caen Cedex 4, 21. Iacona F, Franzo G, Spinella C: Correlation between luminescence and France structural properties of Si nanocrystals. J Appl Phys 2000, 87:1295. 22. Boninelli S, Iacona F, Bongiorno C, Spinella C, Priolo F: Structural properties Authors’ contributions of Si nanoclusters produced by thermal annealing of SiOx films. Mater MR and ET carried out the APT sample preparation by SEM-FIB, performed Res Soc Proc 2004, 817:L6.12.1. and interpreted the APT experiments and wrote the manuscript. FG 23. Schamm S, Bonafos C, Coffin H, Cherkashin N, Carrada M, Ben Assayag G, deposited the samples and performed HR-TEM experiments. PP supervised Claverie A, Tencé M, Colliex C: Imaging Si nanoparticles embedded in the study and participated in the analysis of the results. All authors read and SiO2 layers by (S)TEM-EELS. Ultramicroscopy 2008, 108:346. approved the manuscript. 24. Spinella C, Nicotra G, Bongiorno C, Rimini E: Quantitative determination of the clustered silicon concentration in substoichiometric silicon oxide Competing interests layer. Appl Phys Lett 2005, 87:044102. The authors declare that they have no competing interests. 25. Wang J, Wang X, Li Q, Hryciw A, Meldrum A: The microstructure of SiO thin films: from nanoclusters to nanocrystals. Philos Mag 2010, 87:11. Received: 6 September 2010 Accepted: 23 February 2011 26. Yurtsever A, Weyland M, Muller D: Three-dimensional imaging of Published: 23 February 2011 nonspherical silicon nanoparticles embedded in silicon oxide by plasmon tomography. Appl Phys Lett 2006, 89:151920. References 27. Muller E, Panitz J, McLane S: The Atom-Probe Field Ion Microscope. Rev 1. Canham L: Silicon quantum wire array fabrication by electrochemical Sci Instrum 1968, 39:83. and chemical dissolution of wafers. Appl Phys Lett 1990, 57:1046. 28. Gault B, Vurpillot F, Vella A, Gilbert M, Menand A, Blavette D, Deconihout B: 2. Canham L: Optoelectronics: Gaining light from silicon. Nature 2000, Design of a femtosecond laser assisted tomographic atom probe. Rev Sci 408:411. Instrum 2006, 77:043705. 3. Polman A: Photonic materials: Teaching silicon new tricks. Nat Mater 29. Thompson K, Lawrence D, Larson DJ, Olson JD, Kelly TF, Gorman B: In situ 2002, 1:10. site-specific specimen preparation for atom probe tomography. 4. Fiori AT, Ravindra N: Light emission from silicon: Some perspectives and Ultramicroscopy 2007, 107:131. applications. J Electron Mater 2003, 32:1043. 30. Thompson G, Miller M, Fraser H: Some aspects of atom probe specimen 5. Tiwari S, Rana F, Hanafi H, Harstein A, Crabbe E, Chan K: A silicon preparation and analysis of thin film materials. Ultramicroscopy 2004, 100:25. nanocrystals based memory. Appl Phys Lett 1996, 68:1377. 31. Juraszek J, Grenier A, Teillet J, Cadel E, Tiercelin N, Monnet I, 6. Oda S, Huang S, Salem MA, Hippo D, Mizuta H: Charge storage and Toulemonde M: Atom probe tomography of swift ion irradiated electron/light emission properties of silicon nanocrystals. Physica E 2007, multilayers. Nucl Instrum Methods Phys Res B 2009, 267:912. 38:59. 32. Lardé R, Talbot E, Vurpillot F, Pareige P, Schmerber G, Beaurepaire E, 7. Pavesi L, Dal-Negro L, Mazzoleni C, Franzo G, Priolo F: Optical gain in Dinia A, Pierron-Bohnes V: Investigation at the atomic scale of the Co silicon nanocrystals. Nature 2000, 408:440. spatial distribution in Zn(Co)O magnetic semiconductor oxide. J Appl 8. Delerue C, Allan G, Lannoo M: Theoretical aspects of the luminescence of Phys 2009, 105:126107. porous silicon. Phys Rev B 1993, 48:41102.
- Roussel et al. Nanoscale Research Letters 2011, 6:164 Page 8 of 8 http://www.nanoscalereslett.com/content/6/1/164 33. Daldosso N, Luppi M, Ossicini S, Degoli E, Magri R, Dalba G, Fornasini P, Grisenti R, Rocca F, Pavesi L, Boninelli S, Priolo F, Spinella C, Iacona F: Role of the interface region on the optoelectronic properties of silicon nanocrystals embedded in SiO2. Phys Rev B 2003, 68:085327. 34. Blavette D, Vurpillot F, Pareige P, Menand A: A model accounting for spatial overlaps in 3D atom-probe microscopy. Ultramicroscopy 2001, 89:145. 35. Talbot E, Lardé R, Gourbilleau F, Dufour C, Pareige P: Si nanoparticles in SiO2 An atomic scale observation for optimization of optical devices. Eur Phys Lett 2009, 87:26004. doi:10.1186/1556-276X-6-164 Cite this article as: Roussel et al.: Atomic characterization of Si nanoclusters embedded in SiO2 by atom probe tomography. Nanoscale Research Letters 2011 6:164. Submit your manuscript to a journal and benefit from: 7 Convenient online submission 7 Rigorous peer review 7 Immediate publication on acceptance 7 Open access: articles freely available online 7 High visibility within the field 7 Retaining the copyright to your article Submit your next manuscript at 7 springeropen.com
CÓ THỂ BẠN MUỐN DOWNLOAD

-

Báo cáo hóa học: " Conductive-probe atomic force microscopy characterization of silicon nanowire"
 9 p |
9 p |  54
|
54
|  9
9
-

Báo cáo hóa học: " Atomic force microscopy investigation of the kinetic growth mechanisms of sputtered nanostructured Au film on mica: towards a nanoscale morphology control"
13 p | 63
| 8
-
Báo cáo hóa học: "Research Article Modeling of Electric Disturbance Signals Using Damped Sinusoids via Atomic Decompositions and Its Applications"
15 p | 41
| 7
-
Báo cáo hóa học: " Effect of surrounding environment on atomic structure and equilibrium shape of growing nanocrystals: gold in/on SiO2"
8 p | 45
| 4
-

Báo cáo hóa học: " Site-controlled quantum dots fabricated using an atomic-force microscope assisted technique"
7 p | 46
| 4


Chịu trách nhiệm nội dung:
Nguyễn Công Hà - Giám đốc Công ty TNHH TÀI LIỆU TRỰC TUYẾN VI NA
LIÊN HỆ
Địa chỉ: P402, 54A Nơ Trang Long, Phường 14, Q.Bình Thạnh, TP.HCM
Hotline: 093 303 0098
Email: support@tailieu.vn
Giấy phép Mạng Xã Hội số: 670/GP-BTTTT cấp ngày 30/11/2015 Copyright © 2022-2032 TaiLieu.VN. All rights reserved.

