


Báo cáo hóa học: " Formation of tungsten oxide nanostructures by laser pyrolysis: stars, fibres and spheres"
lượt xem 6
download
 Download
Vui lòng tải xuống để xem tài liệu đầy đủ
Download
Vui lòng tải xuống để xem tài liệu đầy đủ
Tuyển tập báo cáo các nghiên cứu khoa học quốc tế ngành hóa học dành cho các bạn yêu hóa học tham khảo đề tài: Formation of tungsten oxide nanostructures by laser pyrolysis: stars, fibres and spheres
Bình luận(0) Đăng nhập để gửi bình luận!
Nội dung Text: Báo cáo hóa học: " Formation of tungsten oxide nanostructures by laser pyrolysis: stars, fibres and spheres"
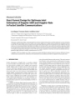
- Govender et al. Nanoscale Research Letters 2011, 6:166 http://www.nanoscalereslett.com/content/6/1/166 NANO EXPRESS Open Access Formation of tungsten oxide nanostructures by laser pyrolysis: stars, fibres and spheres Malcolm Govender1,2, Lerato Shikwambana1,2, Bonex Wakufwa Mwakikunga1*, Elias Sideras-Haddad2,3, Rudolph Marthinus Erasmus2, Andrew Forbes1,4 Abstract In this letter, the production of multi-phase WO3 and WO3-x (where x could vary between 0.1 and 0.3) nanostructures synthesized by CO2-laser pyrolysis technique at varying laser wavelengths (9.22-10.82 mm) and power densities (17-110 W/cm2) is reported. The average spherical particle sizes for the wavelength variation samples ranged between 113 and 560 nm, and the average spherical particle sizes for power density variation samples ranged between 108 and 205 nm. Synthesis of W18O49 (= WO2.72) stars by this method is reported for the first time at a power density and wavelength of 2.2 kW/cm2 and 10.6 μm, respectively. It was found that more concentrated starting precursors result in the growth of hierarchical structures such as stars, whereas dilute starting precursors result in the growth of simpler structures such as wires. Introduction densities, presumably because of the way photon-energy Tungsten trioxide is known as a ‘ smart material ’ , is distributed into the energy levels of the precursor. In this letter, the formation of W18O49 (= WO2.72) and because it exhibits excellent electrochromic, photochro- mic and gasochromic properties. Nano-sized tungsten the effect of the laser power, the wavelength on the trioxide has been applied in many nano-photonic morphology and structural properties of tungsten oxide devices for applications such as photo-electro-chromic nano-structured and thin films are reported. windows [1], sensor devices [2,3] and optical modulation Experimental devices [4]. Many techniques for synthesizing nano-sized tungsten trioxide have been reported [5-8] and this arti- The laser pyrolysis experimental setup was discussed in cle concerns with laser pyrolysis. detail in [10], and a schematic description of the experi- Laser pyrolysis is more advantageous than most meth- ment during laser-precursor interaction is depicted in ods because the experimental orientation does not allow Figure 1. The laser pyrolysis method is carried out the reactants to make contact with any side-walls, so within a custom-made stainless steel chamber at atmo- that the products are of high quality and purity [9]. spheric pressure. A wavelength tunable Continuous Laser pyrolysis is based on photon-induced chemical Wave CO 2 laser was used in the experiments (Edin- reactions, which is believed to rely on a resonant inter- burgh Instruments, model PL6, 2 Bain Square, Kirkton action between a laser beam’s emission line and a pre- Campus, Livingston, UK) and the beam was focused cursor ’ s absorption band, such that a photochemical into the reaction chamber with a 1-m radius of curva- reaction is activated [10]. The photochemical reaction ture concave mirror which is effectively a lens with a enables an otherwise inaccessible reaction pathway focal length of 500 mm. For low power densities, an towards a specific product, either by dissociation, ioniza- unfocused beam was used by replacing the concave mir- tion or isomerisation of the precursor compound. It was ror with a flat mirror. An IR-detector (Ophir-Spiricon, shown [8,11] that low laser power densities can also model PY-III-C-A, Ophir Distribution Center, Science- achieve the same desired products as the high power Based Industrial Park, Har Hotzvim, Jerusalem, Israel) was used to trace out the laser beam profile at various propagation distances from the flat or concave mirror to * Correspondence: BMwakikunga@csir.co.za determine the beam properties. 1 CSIR National Laser Centre, P. O. Box 395, Pretoria 0001, South Africa Full list of author information is available at the end of the article © 2011 Govender et al; licensee Springer. This is an Open Access article distributed under the terms of the Creative Commons Attribution License (http://creativecommons.org/licenses/by/2.0), which permits unrestricted use, distribution, and reproduction in any medium, provided the original work is properly cited.
- Govender et al. Nanoscale Research Letters 2011, 6:166 Page 2 of 8 http://www.nanoscalereslett.com/content/6/1/166 Figure 1 A schematic of laser pyrolysis within the reaction chamber during laser-precursor interaction. (SEM) microscope (using the secondary electron mode). The laser power was varied using a polarization-based Raman spectroscopy was carried out using a Jobin-Yvon attenuator, and the wavelength variation was achieved T64000 Raman Spectrograph with a wavelength of 514.5 with an intra-cavity mounted grating in the laser. The nm from an argon ion laser set at a laser power of 0.384 different wavelengths were identified using a spectrum mW at the sample to minimize local heating of the sam- analyzer (Macken Instruments Inc., model 16A, Coffey ple during the Raman analysis. X-ray diffraction (XRD) Lane, Santa Rosa, California, USA) and the power was carried out using a Philips Xpert powder diffract- output was measured with a power meter (Coherent Inc., ometer equipped with a CuKa wavelength of 154.184 pm. 5100 Patrick Henry Drive, Santa Clara, CA 95054, USA). The synthesis of WO3 and WO3-x commenced by mix- The reproducibility of the experimental procedure was ing 0.1 g of greyish-blue anhydrous tungsten hexachlor- not verified. ide (WCl6, >99.9%, Sigma Aldrich, 3050 Spruce Street, St. Results Louis, MO 63103, USA) powder in 100 mL of absolute ethanol (C2H5OH, >99.9%, Sigma Aldrich) to give a tung- When the CO 2 laser beam was focused with a 1-m sten ethoxide W(OC2H5)6 starting precursor [12]. Opti- radius of curvature mirror, it produced a minimum cal absorption properties of the precursor were beam radius or a beam waist of 1.2 mm, and at a laser power of 50 W on the 10.6-μm emission line, a power determined using a Perkin Elmer Spotlight 400 FTIR Imaging System in the wavelength range 500-4000 cm-1. density of 2.2 kW/cm2 was achieved. These parameters The liquid precursor was decanted into an aerosol were consistent with those obtained when synthesizing WO3 nanowires using a very dilute precursor of 27 μM generator (Micro Mist, model EN, Research Triangle Park, NC 27709, USA) which was attached to the laser [10]. Laser pyrolysis of the more concentrated 2.5 mM pyrolysis system via a multiflow nozzle that allows argon precursor showed many uniform agglomerations com- gas to carry the stream of very fine precursor droplets posed of nanospheres (40 nm) before annealing, (5 μm droplet diameter according to the manufacturer) as depicted in the SEM micrograph in the inset of into the laser beam. Acetylene (C2H2) sensitizer gas and Figure 2. The sample was annealed, and from the agglomerates, stars grew with six points as seen in the argon encasing gas flowed adjacent to the precursor, SEM micrographs of Figure 2. guiding it towards a substrate. The gas flow rates are The Raman and XRD spectra of the samples contain- chosen such that the ablated precursor collects on the ing the stars are shown in Figure 3. The stars were not substrate after interacting with the laser. visible under the Raman microscope and so various The sample was annealed for 17 h at 500°C under spots were analyzed on the sample. The Raman study argon atmosphere [10]. Morphology studies were carried shows that the sample is amorphous after annealing, out using a Jeol JSM-5600 Scanning Electron Microscopy
- Govender et al. Nanoscale Research Letters 2011, 6:166 Page 3 of 8 http://www.nanoscalereslett.com/content/6/1/166 Figure 2 Scanning electron micrographs of the post-annealed sample showing the growth of six-sided stars from the agglomerations of the pre-annealed sample depicted in the inset. and the lack of a dominant peak at 800 cm-1 suggests monoclinic tungsten trioxide [17]. The broad hump at 22° resulted from SiO2 of the substrate, and this sub- the absence of monoclinic phase tungsten trioxide and possibly oxygen deficiency [13,14]. The Raman peaks stantially decreased the signal-to-noise ratio making it found near 224 cm-1, 288 cm-1 and 320 cm-1 are indica- difficult to identify the peaks. XRD peaks at 11, 40 and tive of a W-O-W stretching mode of a tungsten oxide. 64° diffraction angles are also evident in tungsten oxides The Raman peak at 700 cm-1 is designated to the brid- [17], but the 44° diffraction angle suggests that the tung- sten oxide has a deficiency of oxygen [18]. Based on the ging O-W-O vibrations in tungsten trioxide, and the information from Raman spectroscopy and XRD, the asymmetry in this phonon peak shows that there are a most probable stoichiometry of this sample is monocli- number of phonons confined in the tungsten oxide layer nic phase W18O49 (= WO2.72). According to the Powder of particles. This indicates that the product is composed of particles less than 20 nm in size [15,16]. The peak Diffraction File (PDF 00-005-0392) that best matches the XRD spectrum in Figure 3, the lattice constants a, b near 960 cm -1 is assigned to the W6+ = O symmetric and c are 18.28, 3.78 and 13.98 Å, respectively and the stretching mode. lattice angles are a = g = 90° and b = 115.20°. The XRD studies revealed peaks at 23° and 24° diffrac- tion angles which suggests a tungsten oxide compound, The Miller indices are shown on the XRD spectrum in but the lack of a triplet peak confirms the absence of Figure 3. Figure 3 Left: Raman spectrum and Right: XRD spectrum of the sample containing the stars.
- Govender et al. Nanoscale Research Letters 2011, 6:166 Page 4 of 8 http://www.nanoscalereslett.com/content/6/1/166 It is thought that acetylene gas acts as a photosensiti- Previously solid-vapour-solid (SVS) [8] and solution- zer [10] in laser pyrolysis, yet no evidence of absorption liquid-solid (SLS) [19] mechanisms were proposed to in the laser wavelength range 9.19-10.82 μm was found. explain the growth of nanowires of tungsten trioxide and This was verified by passing the acetylene gas through platinum, respectively. Since the tungsten trioxide nano- the laser beam at atmospheric pressure, and monitoring wires were grown with a low precursor concentration the power change during this interaction. The laser using a similar laser beam and laser parameters, the pre- power did not appear to show any change, which cursor concentration is seemingly the main contributor implied that no radiation was absorbed by this gas. This to hierarchical structure. This was confirmed by the 100 does not, however, discount the possibility of some times more concentrated precursor that was used for the short-lived metastable state in acetylene induced by the growth of the stars. The six-sided stars that were grown laser which was undetectable by the power meter. The in Figure 2 looked very similar to lead (II) sulphide (PbS) argon-precursor mixture, however, showed a change in stars that were grown by a concentration difference and power which indicated that the radiation was being gradient (CDG) technique [20]. This CDG technique absorbed, and the maximum absorbance was found at a used a high local concentration of one reactant mixed wavelength of 9.54 μm. The absorbance of the precursor with a low concentration of another reactant under ambi- was given by the ratio of the laser power before laser- ent conditions, where the high concentration favoured precursor interaction to the power observed during the thermodynamic conditions for crystal growth and the laser-precursor interaction. low concentration resulted in a diffusion-controlled Figure 4 shows the absorbance by the precursor as a kinetic environment for growth of hierarchical structures. function of wavelength with the corresponding part of It is possible that due to a Gaussian laser beam profile, which has a high intensity at the beam’s centre and low the FTIR transmission spectrum of tungsten ethoxide. This determination gives us an idea if the laser pyrolysis intensity at the edges, the region of intensity in the mechanism is a resonant process or if the precursor is beam experienced by the precursor could vary the con- decomposed by collisions with excited photosensitizer centration of the decomposed material. It is speculated molecules. However, the results indicate that the laser that this variation in concentration could have led to energy gets transferred to the precursor and should the growth of the hierarchical structures according to cause decomposition by a resonant process, thus leading the CDG technique. The growth of stars has also been to the formation of the predicted products. Therefore, reported before for gold and molybdenum oxide [21,22], acetylene probably provides a reducing atmosphere in but not as yet for tungsten oxide. The literature pro- the laser-precursor interaction that influences the reac- poses that star-shaped structures can be grown from tion pathway towards the formation of the products. agglomerates of more simple nanoforms under an inert To determine how the laser wavelength plays a role in atmosphere, which conditions were similar for this laser pyrolysis, it was varied between 9.19 and 10.84 μm experiment [21,22]. One growth mechanism of nanos- at a constant power of 30 W and power density of tructures could be due to Gibbs-Thompson effect 51.2 W/cm2. The lower power density was achieved by [9,23,24], which proposes that the size of the critical radius is dependent on the precursor concentration and replacing the focusing mirror with a flat mirror to obtain explains the increase (Ostwald ripening) or decrease a beam radius of 6.11 mm. The low power density was (Tiller’s formula) in size of nanostructures. chosen such that all the R- and P-branches of the CO2 The higher concentration probably provided a critical laser supplied a constant power output for the varying radius which resulted in simple nanoforms and the wavelengths. It was also assumed that at such low power growth of stars as opposed to a lower concentration density, minimum heating effects are involved in the which resulted in microspheres and the growth of wires. laser-precursor interaction. It was found that only the 10.48- μ m wavelength formed monoclinic phase WO 3 It is speculated that the critical radius influences the thermodynamic and kinetic conditions as predicted by according to the Raman and XRD spectra shown in the CDG technique. Thus, the laser beam properties Figure 5 with the corresponding SEM micrograph. together with the relative precursor concentration con- The nanosphere diameters of this sample, which were tribute to the growth of stars. Some stars may form easiest to measure on SEM micrograph, were distributed with four-sides and others with six-sides depending on in the range 50-250 nm as depicted in inset of Figure 5, the crystalline plane arrangement and the elements and micron-sized fibres were also present in this sample. composing the structures [20]. It is not yet understood The theory speculates that if the laser wavelength is if the observed deficiency of oxygen plays a role in the resonant with the C-O absorption band of the precursor formation of the six-sided stars or if the higher tungsten (W-O-C2H5), then the C-O bond would break and lead content, with a predominant valency of +6, has some to the formation of tungsten oxide. However, FTIR correlation with the number of sides formed. showed that the C-O absorption band is found between
- Govender et al. Nanoscale Research Letters 2011, 6:166 Page 5 of 8 http://www.nanoscalereslett.com/content/6/1/166 Figure 4 The comparison of the FTIR transmittance spectrum of the tungsten ethoxide precursor and the CO2 laser radiation absorbance data of tungsten ethoxide as a function of wavelength. Figure 5 Left: the Raman spectrum of the sample prepared at the 10.48-μm wavelength and 51.2 W/cm2 power density with a SEM micrograph in the inset showing the morphology. Right: the corresponding XRD spectrum with the histogram of the diameters of a selection of the nanostructures of the corresponding SEM micrograph in the inset. The Raman and XRD suggest a monoclinic phase WO3.
- Govender et al. Nanoscale Research Letters 2011, 6:166 Page 6 of 8 http://www.nanoscalereslett.com/content/6/1/166 9.00-9.38 μm (see Figure 4), and despite argon carrier kW/cm 2 ). The nanosphere diameters of this sample gas presumably broadening the precursor absorption were found to be in the range 150-400 nm as depicted bands to some extent [25], the result could correspond in inset of Figure 6. It was observed that the overall par- to a non-resonant energy transfer. A 10.48-μm wave- ticle sizes were smaller for the power variation experi- length photon carries 0.1 eV of energy, and so 29 ment, while the wavelength variation experiment photons are required to dissociate a C-O bond [26] showed larger particle sizes. The increase in power den- which corresponds to a multi-photon process. It is sity did not always favour the formation of WO3, and known, however, that tungsten ethoxide precursor can since the photon energy was constant, only the number form WO3 upon heat treatment [12], which implies that of photons per unit time varied. the 10.48-μm wavelength could have had similar effects Figure 6 shows the Raman and XRD spectra with the as annealing had. We believe that the shorter wave- corresponding SEM micrograph of a sample prepared at a power density of 85 W/cm 2 at the 10.6- μ m wave- lengths, which had higher energy photons, dissociated various bonds which led to the formation of triclinic length, which appeared to form a monoclinic phase phase or a mixture of monoclinic and triclinic phase WO3 according to the characteristic peaks. WO3-x where x can vary between 0.1 and 0.3, depending Table 1 summarizes all the results obtained for the on the laser parameters. It was also observed that the varying laser parameters. The average particle sizes morphology of the samples became more randomized observed for the wavelength variation was in the range and of a disordered arrangement as the wavelength 113-560 nm, while the average particle sizes for the increased, and this is believed to be an effect of a corre- power density variation were in the range 108-205 nm. sponding decrease in energy. The compositions of some samples were uncertain, and so it is written as WO 3- x where x most likely attains Unlike the increasing wavelength, the increase in power density led to more ordered and shaped nanos- values between 0.1 and 0.3. There were no obvious tructures, presumably because of the increase in energy trends as to how the laser parameters affected the pro- rate. The 10.6 μ m wavelength appeared to favour the duct size or composition, and thus, it is believed that formation of monoclinic phase tungsten oxide Further- some possible competing reactions taking place during more, it was observed that at high enough power densi- the laser-precursor interaction or during annealing. ties, it was more likely for helping nanostructure growth. At such low power densities (17-110 W/cm2) Conclusion on the 10.6 μ m wavelength, the particle sizes did not Six-sided monoclinic phase WO2.72 stars were synthesized show a decrease with increasing power density as pre- by laser pyrolysis technique using a more concentrated dicted [27] for the higher power density range (1-100 starting precursor and near-Gaussian laser beam profile. Figure 6 Left: the Raman spectrum of the sample prepared at the 10.6- μm wavelength and 85 W/cm2 power density with a SEM micrograph in the inset showing the morphology. Right: the corresponding XRD spectrum with the histogram of the diameters of a selection of the nanostructures with the corresponding SEM micrograph in the inset. The Raman and XRD suggest a monoclinic phase WO3-x (x~0.1).
- Govender et al. Nanoscale Research Letters 2011, 6:166 Page 7 of 8 http://www.nanoscalereslett.com/content/6/1/166 Table 1 A summary of the results obtained for the laser power and wavelength variation Power Density Variation (l = 10.6 μm) Wavelength Variation (Pdensity = 51.2 W/cm2) Wavelength, l (mm) Average sphere particle size (nm) Composition Power Density, Ppeak Average sphere particle size (nm) Composition (W/cm2) 9.22 343 m/t-WO3-x 17 157 m-WO3-x 9.32 125 m/t -WO3-x 26 122 m-WO3-x 9.48 113 m/t -WO3-x 34 140 m-WO3 9.70 403 m/t-WO3-x 43 193 m-WO3 10.16 360 t-WO3 51 108 m-WO3-x 10.36 560 t-WO3 60 122 m-WO3-x 10.48 347 m-WO3 68 136 m-WO3 10.82 453 t-WO3 77 180 m-WO3 85 205 m-WO3-x 94 114 m-WO3-x 100 106 m-WO3 110 128 m-WO3 2200 100 m-WO2.72 M, monoclinic phase; t, triclinic phase. The higher concentrated precursors are required to obtain References 1. Bittencourt C, Landers R, Llobet E, Molas G, Correig X, Silva MAP, Sueiris JE, hierarchical structures as predicted by the literature. Laser Calderer J: Effects of Oxygen Partial Pressure and Annealing Temperature wavelengths above 10 μm seem to favour the formation of on the Formation of Sputtered Tungsten Oxide Films. Electrochem Soc stoichiometric WO3, but only at certain power densities, 2002, 149:H81. 2. Kawasaki H, Namba J, Iwatsuji K, Suda Y, Wada K, Ebihara K, Ohshima T: presumably to overcome possible competing reactions. NOx gas sensing properties of tungsten oxide thin films synthesized by Owing to the nature of photochemical reactions and the pulsed laser deposition method. Appl Surf Sci 2002, 197-198:547-551. many stoichiometries and multi-phases that tungsten oxi- 3. Guidi V, Butturi MA, Blo M, Carotta MC, Galliera S, Giberti A, Malagù C, Martinelli G, Piga M, Sacerdoti M, Vendemiati B: Aqueous and alcoholic des can form, some product compositions were written as syntheses of tungsten trioxide powders for NO2 detection. Sens Actuators WO3-x where x most probably assumes values between 0.1 B 2004, 100:277. and 0.3. The higher power densities were found to be 4. Wang SW, Chou TC, Liu CC: Nano-crystalline tungsten oxide NO2 sensor. Sens Actuators B 2003, 94:343. essential for the further growth of structures and for smal- 5. Wang XP, Yang BQ, Zhang HX, Feng PX: Tungsten Oxide Nanorods Array ler particle sizes. The authors now have an idea of the pos- and Nanobundle Prepared by Using Chemical Vapor Deposition sible shapes of nanostructures that can be synthesized with Technique. Nanoscale Res Lett 2007, 2:405-409. 6. Rajagopal S, Nataraj D, Mangalaraj D, Djaoued Y, Robichaud J, Khyzhun O: possible chemical compositions, and the determination of Controlled Growth of WO3 Nanostructures with Three Different the electrical and optical properties of these structures to Morphologies and Their Structural, Optical, and Photodecomposition observe possible unique characteristics allows for the tai- Studies. Nanoscale Res Lett 2009, 4:1335-1342. 7. Mwakikunga BW, Forbes A, Sideras-Haddad E, Scriba M, Manikandan E: Self loring of sensor devices that operate at room temperature assembly and properties of C:WO3 nano-platelets and C:VO2/V2O5 for example. triangular capsules of C:VO2/V2O5 fullerenes and quantum dots produced by laser solution photolysis. Nanoscale Res Lett 2010, 5:389-397. 8. Mwakikunga BW, Forbes A, Sideras-Haddad E, Arendse C: Optimization, Author details 1 yield studies and morphology of WO3 nanowires synthesized by laser CSIR National Laser Centre, P. O. Box 395, Pretoria 0001, South Africa 2 pyrolysis in C2H2 and O2 ambients - validation of a new growth School of Physics, University of the Witwatersrand, Private Bag 3, P. O. Wits 2050, Johannesburg, South Africa 3iThemba Labs, Private Bag 11, Wits 2050, mechanism. Nanoscale Res Lett 2008, 3:372-380. Jan Smuts and Empire Road, Johannesburg, South Africa 4School of Physics, 9. Haggerty JS, Cannon WR: Sinterable powders from laser-driven reactions. In Laser Induced Chemical Reactions. Edited by: J. I. Steinfield. New York, University of KwaZulu-Natal, Private Bag X54001, Durban 4000, South Africa Plenum Press; 1981:165-241. Authors’ contributions 10. Mwakikunga BW, Forbes A, Sideras-Haddad E, Erasmus RM, Katumba G, Masina B: Synthesis of tungsten oxide nanostructures by laser pyrolysis. MG carried out all the experiments in conjunction with LS. MG also initiated Int J Nanopart 2008, 1:185-200. the first draft manuscript. BWM assisted with the production of thin films by 11. Bowden CM, Stettler JD, Witriol NM: An excitation model for laser-induced laser pyrolysis, characterization, analysis, interpretation of experimental results photochemical reactions. J Phys B Atom Mol Phys 1977, 10:1789. and manuscript handling. AF performed the optical alignment of the laser 12. Sakka S: Handbook of Sol-Gel Science and Technology: Processing, pyrolysis and discussion of the manuscript. ESH contributed through Characterization and Applications. Boston: Kluwer Academic Publishers; discussion of the manuscript and RE provided the Raman spectral data from 2004. all samples. 13. Lu DY, Chen J, Zhou J, Deng SZ, Xu NS, Xu JB: Raman spectroscopic study of oxidation and phase transition in W18O49 nanowires. J Raman Conflicts of interest Spectrosc 2007, 38:176-180. The authors declare that they have no conflict of interests. 14. Lu DY, Chen J, Deng SZ, Xu NS, Zhang WH: The most powerful tool for the structural analysis of tungsten suboxide nanowires: Raman Received: 25 October 2010 Accepted: 23 February 2011 spectroscopy. J Mater Res 2008, 23:402-408. Published: 23 February 2011
- Govender et al. Nanoscale Research Letters 2011, 6:166 Page 8 of 8 http://www.nanoscalereslett.com/content/6/1/166 15. Mwakikunga BW, Sidera-Haddad E, Forbes A, Arndse C: Raman spectroscopy of WO3 nano-wires and thermo-chromism study of VO2 belts produced by ultrasonic spray and laser pyrolysis techniques. Phys Status Solidi A 2004, 205:150-154. 16. Arora AK, Rajalakshmi M, Ravindran TR: Phonon Confinement in Nanostructured Materials. In Encyclopedia of Nanoscience and Nanotechnology, Volume X. Edited by: Nalwa HS. Los Angeles: American Scientific Publishers; 2003:1-13. 17. Ganesan R, Gedanken A: Synthesis of WO3 nanoparticles using a biopolymer as a template for electrocatalytic hydrogen evolution. Nanotechnology 2008, 19:025702. 18. Microelectronic capacitor with capacitor plate layer formed of tungsten rich tungsten oxide material. 2002 [http://www.surechem.org], Patent 6456482. 19. Chen J, Wiley BJ, Xia Y: One-dimensional nanostructures of metals: large- scale synthesis and some potential applications. Langmuir 2007, 27:4120-4129. 20. Chu H, Li X, Chen G, Jin Z, Zhang Y, Li Y: Inorganic hierarchical nanostructures induced by concentration difference and gradient. Nano Res 2008, 1:213-220. 21. Kharissova OV, Kharisov BI, García TH, Méndez UO: A Review on Less- common Nanostructures. Synth React Inorg Met-Org Nano-Met Chem 2009, 39:662-684. 22. Khademi A, Azimirad R, Zavarian AA, Moshfegh AZ: Growth and Field Emission Study of Molybdenum Oxide Nanostars. J Phys Chem C 2009, 44:19298-19304. 23. Qin-bo W, Finsy R, Hai-bo X, Xi L: On the critical radius in generalized Ostwald ripening. J Zhejiang Univ 2005, 6B:705-707. 24. Tiller WA: The Science of Crystallization: Microscopic Interfacial Phenomenon New York: Cambridge University Press; 1991. 25. El-Diasty F: Simulation of CO2 laser pyrolysis during preparation of SiC nanopowders. Opt Commun 2004, 241:121-135. 26. Glockler G: Carbon Halogen Bond Energies and Bond Distances. J Phys Chem 1958, 62:1049-1054. 27. Bomatí-Miguel O, Zhao XQ, Martelli S, Di Nunzio PE, Veintemillas- Verdaguer S: Modeling of the laser pyrolysis process by means of the aerosol theory: Case of iron nanoparticles. J Appl Phys 2010, 107:014906. doi:10.1186/1556-276X-6-166 Cite this article as: Govender et al.: Formation of tungsten oxide nanostructures by laser pyrolysis: stars, fibres and spheres. Nanoscale Research Letters 2011 6:166. Submit your manuscript to a journal and benefit from: 7 Convenient online submission 7 Rigorous peer review 7 Immediate publication on acceptance 7 Open access: articles freely available online 7 High visibility within the field 7 Retaining the copyright to your article Submit your next manuscript at 7 springeropen.com
CÓ THỂ BẠN MUỐN DOWNLOAD

-

Báo cáo hóa học: " Study of the formation processes of gold droplet arrays on Si substrates by high temperature anneals"
 8 p |
8 p |  71
|
71
|  7
7
-

Báo cáo hóa học: " Research Article Capacity Performance of Adaptive Receive Antenna Subarray Formation for MIMO Systems"
12 p | 46
| 5
-

Báo cáo hóa học: " Cross-Layer Design of an Energy-Efficient Cluster Formation Algorithm with Carrier-Sensing Multiple Access for Wireless Sensor Networks"
14 p | 39
| 5
-
Báo cáo hóa học: " Formation and Organization of Amino Terminated Self-assembled Layers on Si(001) Surface"
5 p | 41
| 4
-
Báo cáo hóa học: " Research Article Burst Format Design for Optimum Joint Estimation of Doppler-Shift and Doppler-Rate in Packet Satellite Communications"
12 p | 47
| 4
-

Báo cáo hóa học: " Self-assembled InAs quantum dot formation on GaAs ring-like nanostructure templates"
6 p | 44
| 4
-

Báo cáo hóa học: " Research Article An Efficient Implementation of the Sign LMS Algorithm Using Block Floating Point Format"
7 p | 44
| 3


Chịu trách nhiệm nội dung:
Nguyễn Công Hà - Giám đốc Công ty TNHH TÀI LIỆU TRỰC TUYẾN VI NA
LIÊN HỆ
Địa chỉ: P402, 54A Nơ Trang Long, Phường 14, Q.Bình Thạnh, TP.HCM
Hotline: 093 303 0098
Email: support@tailieu.vn
Giấy phép Mạng Xã Hội số: 670/GP-BTTTT cấp ngày 30/11/2015 Copyright © 2022-2032 TaiLieu.VN. All rights reserved.

