


Báo cáo hóa học: " Multichannel Dynamic-Range Compression Using Digital Frequency Warping"
lượt xem 3
download
 Download
Vui lòng tải xuống để xem tài liệu đầy đủ
Download
Vui lòng tải xuống để xem tài liệu đầy đủ
Tuyển tập báo cáo các nghiên cứu khoa học quốc tế ngành hóa học dành cho các bạn yêu hóa học tham khảo đề tài: Multichannel Dynamic-Range Compression Using Digital Frequency Warping
Bình luận(0) Đăng nhập để gửi bình luận!
Nội dung Text: Báo cáo hóa học: " Multichannel Dynamic-Range Compression Using Digital Frequency Warping"
- EURASIP Journal on Applied Signal Processing 2005:18, 3003–3014 c 2005 J. M. Kates and K. H. Arehart Multichannel Dynamic-Range Compression Using Digital Frequency Warping James M. Kates GN ReSound, c/o Department of Speech, Language & Hearing Sciences, University of Colorado at Boulder, 409 UCB, Boulder, CO 80309, USA Email: jkates@gnresound.dk Kathryn Hoberg Arehart Department of Speech, Language & Hearing Sciences, University of Colorado at Boulder, 409 UCB, Boulder, CO 80309, USA Email: kathryn.arehart@colorado.edu Received 22 March 2004; Revised 13 September 2004 A multichannel dynamic-range compressor system using digital frequency warping is described. A frequency-warped filter is realized by replacing the filter unit delays with all-pass filters. The appropriate design of the frequency warping gives a nonuniform frequency representation very close to the auditory Bark scale. The warped compressor is shown to have substantially reduced group delay in comparison with a conventional design having comparable frequency resolution. The warped compressor, however, has more delay at low than at high frequencies, which can lead to perceptible changes in the signal. The detection threshold for the compressor group delay was determined as a function of the number of all-pass filter sections in cascade needed for a detectible change in signal quality. The test signals included clicks, vowels, and speech, and results are presented for both normal-hearing and hearing-impaired subjects. Thresholds for clicks are lower than thresholds for vowels, and hearing-impaired subjects have higher thresholds than normal-hearing listeners. A frequency-warped compressor using a cascade of 31 all-pass filter sections offers a combination of low overall delay, good frequency resolution, and imperceptible frequency-dependent delay effects for most listening conditions. Keywords and phrases: hearing aids, dynamic-range compression, frequency warping, delay perception. bank, with different degrees of compression in each chan- 1. INTRODUCTION nel. Multichannel dynamic-range compression is an important The design of a multichannel compressor involves a fun- feature in hearing aids (Kates [1]). Compared to normal lis- damental trade-off between frequency resolution and time teners, hearing-impaired listeners typically have elevated au- delay. For any given processing approach, increased fre- ditory thresholds which interfere with the perception of low- quency resolution comes at the price of increased process- intensity sounds. However, the perception of loudness for in- ing delay. In this paper, a new compression algorithm based tense sounds is often similar to that of normal-hearing listen- on digital frequency warping is introduced. Compared to ers. Thus, an objective of a hearing aid is to fit the dynamic conventional digital processing algorithms, the use of dig- range of speech and everyday sounds into the restricted dy- ital frequency warping inherently gives frequency resolu- namic range of the impaired ear. Furthermore, hearing losses tion on an auditory frequency scale, and also reduces the are typically frequency-dependent, so the compressor should amount of processing delay for a specified degree of low- provide different amounts of dynamic-range compression frequency resolution. However, the processing delay of the in different frequency regions. The solution to this design frequency-warped compressor is frequency-dependent, with problem is generally a multichannel system, such as a filter greater delay at low frequencies than at high frequencies. The frequency-warped compressor design must therefore take into account the frequency resolution, overall system This is an open access article distributed under the Creative Commons processing delay, and delay variation across frequency. The Attribution License, which permits unrestricted use, distribution, and objective is to design a compression system that has good reproduction in any medium, provided the original work is properly cited.
- 3004 EURASIP Journal on Applied Signal Processing frequency resolution while avoiding audible artifacts caused tional counterparts to achieve comparable perceptual ben- efits. Warped filters have also proven effective in modeling by the processing delay. the acoustic properties of musical instruments, reducing the 1.1. Frequency resolution necessary filter orders by a factor of five to ten, and in reduc- ing the filter order needed to model the head-related transfer One concern in designing a multichannel compressor is function (HRTF) used in synthesizing 3D sound localization to match the frequency resolution of the digital system to cues (Karjalainen et al. [12]). the resolution of the human auditory system. For example, several hearing-aid fitting procedures are based on loudness 1.2. Delay effects in speech production scaling in the impaired ear (Dillon et al. [2]), and the esti- A second concern in designing a compression system for a mation of loudness presupposes an auditory frequency anal- hearing aid is the overall processing delay. These time delays ysis. Digital frequency analysis, such as the discrete Fourier can cause coloration effects to occur when the hearing-aid transform, typically provides constant-bandwidth frequency user is talking. When talking, the talker’s own voice reaches resolution. The frequency resolution of the human auditory the cochlea with minimal delay via bone conduction and system, however, is more accurately modeled by a filter bank through the hearing-aid vent. This signal interacts with the having a nearly constant bandwidth at low frequencies but delayed and amplified signal produced by the hearing aid to with bandwidth becoming proportional to frequency as the produce a comb-filtered spectrum at the cochlear. Delays as frequency increases (Moore and Glasberg [3]; Zwicker and short as 3 to 6 milliseconds that are constant across frequency Terhardt [4]). are detectible (Agnew and Thornton [13]; Stone and Moore The mismatch between digital and auditory frequency [14]), and overall delays in the range of 15 to 20 millisec- analyses can be greatly reduced if the conventional uniform onds can be judged as disturbing or objectionable (Stone and frequency analysis is replaced by a warped frequency analy- Moore [14, 15]). sis. Frequency warping uses a conformal mapping to give a Stone and Moore [16] also studied the effects of nonuniform spacing of frequency samples around the unit circle in the complex-z plane (Oppenheim et al. [5]; Oppen- frequency-dependent group delay on the production of speech by ten listeners with bilateral cochlear hearing loss. heim and Johnson [6]). With an appropriate choice of the pa- A delay ranging from 0 to 24 milliseconds was added to the rameters governing the conformal mapping (Smith and Abel low frequencies relative to the fixed broadband system de- [7]), the reallocation of frequency samples comes very close lay of 2.5 milliseconds. The low-frequency delay thus ranged to the Bark frequency scale (Zwicker and Terhardt [4]) used from 2.5 to 26.5 milliseconds, while the high-frequency delay to describe the auditory frequency representation. Frequency remained at 2.5 milliseconds. The frequency-dependent de- warping therefore allows the design of digital audio systems lays did not significantly affect the subjects’ word production that have uniform time sampling but which have a frequency rates. However, the subjects’ perception of their own voices representation similar to that of the human auditory system was significantly affected by the group delay; mean ratings ¨¨ (Harma et al. [8]; Karjalainen et al. [9]). of speech processed with a 20-millisecond additional low- Frequency warping can be used to design both finite- frequency delay were “disturbing” and an additional low- impulse response (FIR) and infinite-impulse response (IIR) frequency delay of 9 milliseconds was significantly more dis- filters (Karjalainen et al. [10]). A frequency-warped FIR fil- turbing than no additional low-frequency delay. ter, for example, can be designed by replacing the unit delays The results for delays independent of frequency indi- in the conventional FIR filter with all-pass filter sections. Im- cate that overall processing delays of 10 to 15 milliseconds proved frequency resolution in a conventional FIR filter re- will be acceptable under most speaking conditions. How- quires increasing the filter length, which leads to an increase ever, the frequency-dependent delay results indicate that low- in the filter group delay. Similarly, improved frequency reso- frequency delays of 9 to 15 milliseconds, when added to the lution in a warped FIR filter requires an increase in the num- overall system delay of 2.5 milliseconds, can cause signifi- ber of all-pass filter sections that comprise the filter, which cant subjective disturbance. Thus total low-frequency delays also leads to an increase in the filter delay. Thus, there is a of less than 11.5 milliseconds, and across-frequency delays of trade-off between frequency resolution and group delay for less than 9 milliseconds, are necessary to ensure that objec- both conventional and warped filters, although the warped tionable delays will be avoided for most talking conditions. filter has less delay at low frequencies than a conventional fil- ter for the same low-frequency resolution. 1.3. Frequency-dependent delay effects in listening Frequency warping has been shown to be effective in a number of audio applications. Linear predictive coding The compression system described in this paper uses fre- (LPC) of speech using frequency warping (Strube [11]) was quency warping to reduce the system delay while still provid- found to give higher speech intelligibility and quality than ing good frequency resolution on a critical-band frequency conventional LPC for predictor orders below eight, although scale. However, the delay in the warped system is frequency- for higher predictor orders, the frequency warping offered dependent, with a greater delay at low than at high frequen- little benefit. Loudspeaker equalization filters designed di- cies. This frequency-dependent delay can also introduce au- rectly in the warped frequency domain (Karjalainen et al. [9]) dible artifacts when listening to speech even when the user were found to require a lower filter order than their conven- of the hearing aid is not talking. For example, a click is
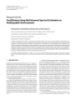
- Frequency-Warped Compressor 3005 converted into a descending chirp when passed through a 1.4. Objectives cascade of all-pass filters having a group delay that increases The purpose of this paper is to describe a dynamic-range with decreasing frequency. compression system based on digital frequency warping, Relatively short delays can be detected for click stim- and to determine the detection threshold for the frequency- uli when the group delay varies across frequency. Blauert dependent group delay inherent in the warped compression and Laws [17] passed clicks through all-pass filters giv- system. The paper begins with a description of frequency ing increased delay in narrow-frequency regions, and found warping and the benefits of using symmetric warped filters. that normal-hearing subjects can detect delays as short as 1 The warped compressor algorithm is then described, and its millisecond at 2 kHz, with the detection threshold increas- group-delay behavior is illustrated. The warped compressor ing to 2 milliseconds at 8 kHz or 1 kHz. In experiments using is shown to have substantially reduced delay in comparison Huffman sequences and normal-hearing subjects, Green [18] with a conventional design having comparable frequency res- found a delay detection threshold of 2 milliseconds indepen- olution. Good frequency resolution can be achieved with an dent of frequency. In experiments using click-like stimuli and overall delay that would be expected to fall below the thresh- normal-hearing subjects, Banno et al. [19] found a detection old for audible interference when the hearing-aid user is talk- threshold of 2 milliseconds for group-delay variations that ing. spanned more than one equivalent rectangular bandwidth The warped compression system, however, introduces a (ERB). However, they found that the threshold of detection frequency-dependent group delay. The detection threshold was approximately 8 to 10 milliseconds for group-delay vari- for the group delay is then determined as the number of all- ations that were constrained to lie within an ERB; these re- pass filter sections in cascade needed for a detectible change sults suggest that in normal-hearing listeners, cross-channel in the signal. The test signals include clicks, synthetic vow- phase effects may be more important than within-channel els, and speech, and results are presented for both normal- effects for short stimuli. hearing and hearing-impaired subjects. The paper concludes Group-delay detection thresholds for speech are greater with recommendations for warped compressor design con- sidering the trade-offs between frequency resolution, pro- than for clicks. Based on results using one normal-hearing subject, Greer [20] reported detection thresholds between cessing delay, and the ability to detect frequency-dependent 0.0625 and 0.125 millisecond for dispersed impulses when delay effects while listening. passed through all-pass filters that give increased delay in narrow frequency regions. For all-pass filters having group- 2. COMPRESSION ALGORITHM delay effects occurring over a frequency region that corre- 2.1. Digital frequency warping sponded to approximately 20 percent of the filter’s center Digital frequency warping is achieved by replacing the unit frequency, detection thresholds for speech sounds were 4 delays in a digital filter with first-order all-pass filters (Op- to 8 milliseconds for a plosive, 8 to 16 milliseconds for a penheim et al. [5]; Oppenheim and Johnson [6]; Karjalainen vowel, and 16 to 32 milliseconds for a fricative. For all-pass ¨¨ et al., [9]; Smith and Abel [7]; Harma et al. [8]). The all-pass filters having group-delay effects occurring over a broader filter is given by frequency region corresponding to approximately the filter’s center frequency, the detection thresholds were 2 to 4 mil- z −1 − a A(z ) = , (1) liseconds for a plosive, 2 to 4 milliseconds for a vowel, and 4 1 − az−1 to 8 milliseconds for a fricative. The results of Greer [20] are where a is the warping parameter. The frequency warping consistent with those of Banno et al. [19] in that the detec- that results for different choices of the parameter a is illus- tion threshold is lower for all-pass filters spanning more than one ERB. trated by Oppenheim and Johnson [6] and Karjalainen et al. [9]. The value for the warping parameter that gives a clos- The frequency-dependent group delay also can interfere est fit to the Bark frequency scale is a = 0.5756 for a 16 kHz with speech intelligibility, but at delays that greatly exceed sampling rate (Smith and Abel [7]). The group delay for this the detection thresholds. Stone and Moore [16] found that choice of parameters is illustrated in Figure 1. The delay at hearing-impaired listeners’ identification of nonsense sylla- low frequencies exceeds one sample, while the delay at high bles decreased by a small but significant amount as the low- frequency delay was increased (from 72.3 percent at no delay frequencies is less than one sample. to 68.1 percent at 24 milliseconds additional low-frequency The warped FIR filter transfer function is the weighted sum of the outputs of each all-pass section: delay). Arai and Greenberg [21] introduced delay variations as a function of frequency in sentence materials, and found K that word identification accuracy for normal-hearing sub- bk Ak (z), B (z ) = (2) jects decreased as the delay variations increased. However, k =0 listeners maintained good word identification (75%) with for a filter having K + 1 taps (K all-pass sections). Forcing across-band delay variations of 140 milliseconds; this de- the real filter coefficients {bk } to have even symmetry for an lay duration is long enough to encompasses two or more unwarped FIR filter yields a linear-phase filter, in which the phonemes, and therefore represents a scrambling of the or- filter delay is independent of the coefficients as long as the der of portions of the speech sounds.
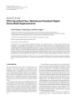
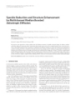
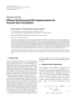
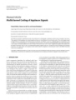
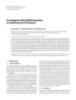
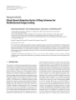
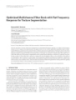
- 3006 EURASIP Journal on Applied Signal Processing 4 Input x(n) y (n) FIR buffer filter 3.5 K taps K /2 samples Copy cOEF. (linear phase) 3 Group delay (samples) K -point buffer K -point IFFT K -point FFT and window equalization (zero phase) Compression gain vs. freq. 2.5 Frequency ··· ··· ··· ··· 2 1.5 Figure 2: Block diagram of a compressor using a side branch for 1 frequency analysis, with compression gains applied to the signal 0.5 through an FIR filter in the signal path. 0 0.2 0.4 0.6 0.8 0 1 Normalized frequency (Nyquist = 1) The filter delay is determined by evaluating (4) on the unit circle. Because A−1 (e jω ) = A∗ (e jω ), the term inside the sum- Figure 1: Group delay in samples for a single all-pass filter section with a = 0.5756 at a sampling rate of 16 kHz. mation is pure real and does not contribute to the filter group delay, while the term outside the summation in (4) repre- sents a fixed frequency-dependent group delay. The symmet- ric warped FIR filter thus has a fixed group delay that does symmetry is preserved. If the unwarped FIR filter has K + 1 not depend on the actual filter coefficients as long as the taps, the delay is K/ 2 samples. Similarly, forcing even sym- symmetry is maintained. For example, a warped filter using metry for the coefficients of a warped FIR filter gives a fil- 31 all-pass filter sections and symmetric real coefficients will ter having a fixed frequency-dependent group delay that is have a delay equal to that of 15 sections. independent of the actual filter-coefficient values. As shown in (3) and (4), if the warped FIR filter has K + 1 taps, 2.2. Warped compression system the group delay is K/ 2 times that of a single all-pass filter. An effective design for a compressor is to use a side branch This filter-coefficient symmetry property guarantees that no for the frequency analysis, with the analysis generating the phase modulation will occur as the compressor changes gain coefficients of a filter placed in the signal path (Williamson in response to the incoming signal, thus avoiding the ques- et al. [22]). Either a filter bank or an FFT can be used for the tion of the audibility of phase-modulation effects. Further- frequency analysis; an FFT-based side-branch system is illus- more, in a binaural fitting (hearing aids on both ears), the co- trated in Figure 2. The approximation to auditory frequency efficient symmetry ensures that identical amounts of group analysis is provided by using individual frequency FFT bins delay are introduced at the two ears by the hearing-aid pro- at low frequencies, and summing groups of adjacent FFT bins cessing, thus preserving the interaural phase differences that at high frequencies. The signal processing delay for this sys- are used for sound localization. tem is the buffer size plus the delay associated with the FIR Consider a warped FIR filter having even symmetry and filter; additional delay is caused by the A/D and D/A convert- an even number of taps. The analysis for an odd number of ers and code execution time. taps is similar. The z-transform of a warped FIR filter is given The resolution of the frequency analysis performed in the by (2). Assume that the filter coefficients are real and have side branch is limited by the size of the FFT and its associ- even symmetry, giving bk = bK −k . For K odd, the filter has ated input buffer. For example, when a 32-point FFT is com- an even number of taps and the z-transform can be rewritten puted, the positive frequency samples can be combined to as give nine overlapping frequency bands using individual FFT bins at low frequencies and combining bins at frequencies (K −1)/ 2 bk Ak (z) + A(K −k) (z) . B (z ) = above 1 kHz. A Blackman window was found to give the best (3) combination of frequency resolution and sidelobe suppres- k=0 sion for the 32-point FFT. Increasing the FFT size would give better frequency resolution, but would also increase the sys- Rearranging the delay terms leads to tem’s processing delay due to the larger input buffer size and (K −1)/ 2 the longer filter length. bk AK/2 (z) A(k−K/2) (z) + A−(k−K/2) (z) B (z ) = A dynamic-range compression system using warped fre- k=0 quency analysis is presented in Figure 3. The basic design (4) is similar to the side-branch compressor shown in Figure 2. (K −1)/ 2 = AK/2 (z) bk A(k−K/2) (z) + A−(k−K/2) (z) . The compressor combines a warped FIR filter and a warped FFT. The same tapped delay line is used for both the k=0
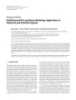
- Frequency-Warped Compressor 3007 K 2.3. Simulation results 1 2 x(n) y (n) + A(z) A( z ) A(z) × ··· Two compression systems were simulated for the perfor- + + · · p0 (n) p1 (n) pK (n) mance evaluation. The systems operated at a 16 kHz sam- · × pling rate and were simulated in MATLAB using floating- point arithmetic. The first compressor is the side-branch sys- × tem of Figure 2. For a short system delay, a 16-sample buffer ··· FFT of windowed segment is used for the block time-domain processing, and the sig- gK (n) ··· nal is processed by a 31-tap FIR filter. The frequency analysis Gain calculation (real values) uses a 32-point FFT operating on the present and previous ··· 16-point data segments. A window is used to provide ad- g1 (n) IFFT (symmetric filter coefficients) equate FFT smoothing at low frequencies, and overlapping g0 (n) FFT bins are summed to give the analysis bands at high fre- ··· Apply window to filter coefficients quencies. This system has a total of 9 analysis bands, with a low-frequency resolution of 500 Hz. The frequency reso- ··· lution can be improved by increasing the FFT size, but the system delay will also be increased. The compression gains Figure 3: Block diagram of a compressor using frequency warping are calculated in the frequency domain, and the gains inverse for both frequency analysis and filtered signal synthesis. transformed to give the symmetric compression filter used to modify the incoming signal. The second compressor is the warped FIR side-branch frequency analysis and the FIR compression filter. The in- system of Figure 3 in which a 16-sample data buffer and a 32- coming signal x(n) is passed through a cascade of first-order point FFT are used in conjunction with a 31-tap warped FIR all-pass filters of the form given by (1), with the output of filter. This compressor is essentially the frequency-warped the kth all-pass stage given by pk (n). The sequence of delayed version of the side-branch compressor of Figure 2. The in- samples { pk (n)} is then windowed, and an FFT is calculated put data segment is windowed with a 32-point Hann win- using the windowed sequence. The result of the FFT is a dow, and no frequency-domain smoothing is applied to the spectrum sampled at a constant spacing on a Bark frequency spectrum. The compression gains are smoothed by applying scale. The algorithm can be implemented on a sample-by- a 31-point Hann window to the compression filter after the sample basis or using block data processing. Block processing gain values are transformed into the time domain. This sys- is typically used with the FFT computed after a block of sam- tem is termed the Warp-31 compressor. ples is read in and processed through the cascade of all-pass The Warp-31 compressor provides frequency analysis filters; the compression gains are therefore updated once per with a separation of approximately 1.3 Bark. There are a to- block. tal of 17 bands covering the positive frequencies, including 0 Because the data sequence is windowed, the spectrum is and π radians. The low-frequency bands are approximately smoothed in the warped frequency domain, giving smoothly spaced at multiples of 135 Hz, with the spacing increasing overlapping frequency bands. The compression gains are to 1800 Hz at the highest frequency. The side-branch com- then computed from the warped power spectrum for the au- pressor using the 32-point FFT, on the other hand, uses the ditory analysis bands. The compression gains are pure real output of the FFT to approximate frequency bands on a Bark numbers, so the inverse FFT to give the warped time-domain scale. The limited resolution of the short FFT with its uni- filter results in a set of filter coefficients that is real and form 500 Hz bin spacing causes a poor match between the has even symmetry. The system output is then calculated by side-branch frequency bands and the Bark band spacing at convolving the delayed samples with the compression gain low frequencies. At high frequencies, however, FFT bins can filter: be combined to give a reasonably good match. To achieve the same low-frequency resolution as the Warp-31 system, the K side-branch compressor requires an FFT size of 128 points y ( n) = gk (n) pk (n), (5) which gives a bin spacing of 125 Hz. k=0 The frequency resolution of the Warp-31 system is illus- where {gk (n)} are the compression filter coefficients. trated in Figure 4. Each curve in the figure represents the In comparison with a conventional FIR system having warped FFT magnitude frequency response to a steady-state the same FIR filter length, the warped compression system sinusoid at the indicated frequency. The sinusoids were cho- will require more computational resources because of the all- sen to lie at the center frequencies of 5 of the 17 warped pass filters in the tapped delay line. However, in many cases frequency bands. The shapes of the power spectra for the dif- the warped FIR filter will be shorter than the conventional ferent excitation frequencies are essentially shifted versions FIR filter needed to achieve the same degree of auditory fre- of the same basic response. The response at the adjacent fre- quency resolution. A nine-band compressor, for example, re- quency band is about 5 dB below the response at the exci- quires a 31-tap conventional FIR filter but can be realized tation frequency, and the average slope of the response over with a 15-tap warped FIR filter. the first octave is about 50 dB/oct. Replacing the Hann with
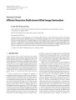
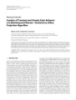
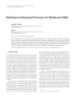
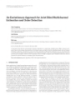
- 3008 EURASIP Journal on Applied Signal Processing 80 11 566 1340 Hz 2937 8000 10 Side branch, 0 70 128-point FFT 9 60 8 Group delay (ms) 7 50 6 dB 40 Warp-31 Side branch, 5 32-point FFT 30 4 3 20 2 10 1 0 0 1 3 5 7 9 11 13 15 17 0 1 2 3 4 5 6 7 8 Frequency band Frequency (kHz) Figure 4: Power spectra for the Warp-31 frequency analysis for Figure 5: Group delay versus frequency for digital compressors steady-state sinusoidal excitations at the indicated warped FFT bin based on the side-branch compressor using a 16-sample input buffer and a 32-point FFT (dashed line), 64-sample buffer and a center frequencies. The excitation signal is at a level of 70 dB SPL. 128-point FFT (dotted line), and the Warp-31 system (solid line). a different window shape will modify the spectral response 1 in manner comparable to the effects of the window on a con- 0.8 ventional FFT. 0.6 The overall system processing group delay is due to sev- 0.4 eral factors. Certain aspects of the overall system delay, such as the A/D and D/A converter delays, are fixed by the hard- 0.2 Amplitude ware and are not affected by the signal processing. The to- 0 tal software processing delay is the sum of the time re- quired to fill the input buffer, the group delay inherent in the −0.2 frequency-domain or time-domain filtering operation pro- −0.4 vided by the compressor, and the time needed to execute the −0.6 code before the output signal is available. −0.8 The side-branch compressor uses a linear-phase FIR fil- ter, so the delay is independent of frequency. The Warp-31 −1 compressor uses all-pass filters to replace the unit delays in 0 1 2 3 4 5 6 the FIR filter implementation, so this system has a frequency- Time (ms) dependent delay. The total delay for the Warp-31 compressor Figure 6: Impulse response for the Warp-31 compressor having a is an estimate assuming that the hardware delays and the time flat frequency response. needed for the code execution will be similar to that needed for the side-branch compressor, with an additional allowance for the all-pass filters. The delay values for the 32-point FFT liseconds at high frequencies. Thus the Warp-31 compressor version of the side-branch compressor are based on measure- ments of an actual hearing aid, and assume 2.5 milliseconds has delay characteristics similar to those of the side-branch system with a 32-point FFT, while providing frequency reso- for the hardware and code execution and 1 milliseconds for the 16-sample input buffer. lution that can only be achieved when a 128-point FFT with its much greater delay is used. The warped compressor thus The group delay for the compression systems is plotted has substantially reduced delay in comparison with a conven- in Figure 5. The side-branch system has a constant delay as a tional design having comparable frequency resolution, and function of frequency because of the linear-phase filters used for the processing. The delay is 3.5 milliseconds for an FFT the resultant delay in the Warp-31 system would be expected size of 32 points, and increases to 10.5 milliseconds when the to fall below the threshold of approximately 9 milliseconds for audible interference when the hearing-aid user is talking. FFT size is increased to 128 points. The Warp-31 system has The Warp-31 system has a relative delay of 3.2 millisec- a smooth frequency-dependent delay due to the group-delay onds at low frequencies compared to the delay at high fre- characteristics of the all-pass filters used for the warped FIR quencies. The impulse response of the Warp-31 system with filtering. The maximum delay for the Warp-31 compressor is 6.1 milliseconds at 0 Hz, with the delay falling to 2.9 mil- a flat frequency response is the same as for a cascade of
- Frequency-Warped Compressor 3009 Table 1: Age, gender, test ear, and audiometric thresholds (dB HL) of listeners with hearing loss (NR means no response). Frequency (Hz) Age Subject Ear Gender 250 500 1000 2000 4000 8000 I1 50 F L 70 70 85 80 80 85 I2 61 M R 25 10 35 60 55 60 I3 64 M R 30 50 65 70 65 70 I4 38 F R 25 30 50 60 75 60 I5 75 F L 50 50 65 60 60 75 I6 78 M L 50 45 50 65 70 95 I7 44 F R 15 20 35 55 95 NR I8 26 F L 25 30 45 50 50 45 I9 69 F L 80 75 60 55 40 55 I10 22 F R 30 35 50 55 55 60 I11 76 M R 15 30 40 40 60 90 15 all-pass filter sections; the impulse response, shown in group of normal-hearing listeners and a group of hearing- Figure 6, illustrates the relative delay between the initial high- impaired listeners. The conditions included in this study frequency output of the filter and the later low-frequency were ones in which processed sounds are perceived alone, not output. In processed speech, the effects of the group delay combined with unprocessed sounds. As such, the conditions will be to delay the onset of the first formant relative to studied here are applicable to situations in which a hearing- the second and third formants. The low-frequency content aid wearer is listening but not talking. of bursts, as in stops and plosives, will also be delayed rel- ative to the high-frequency content. Stone and Moore [16] 3.1. Method found no significant effect of low-frequency delay on voic- 3.1.1. Listeners ing information for hearing-impaired subjects. They found that low-frequency delays greater than 15 milliseconds were Ten listeners with normal hearing and 11 listeners with hear- significant for manner information (Miller and Nicely [23]), ing loss participated in this study. Listeners with normal which consists of nasality, affrication, and duration, and de- hearing had thresholds of 20 dB HL or better at octave fre- lays greater than 9 milliseconds were significant for place in- quencies from 250 to 8000 Hz, inclusive. Listeners with hear- formation. The 3.2-millisecond relative low-frequency delay ing loss demonstrated test results consistent with cochlear of the Warp-31 system should therefore have no measurable pathology: normal tympanometry, absence of otoacoustic effect on speech intelligibility. emissions in regions of threshold loss, and absence of an air- bone gap exceeding 10 dB at two or more frequencies. Lis- teners with hearing loss had a mild-to-severe hearing loss. 3. DETECTION OF FREQUENCY-DEPENDENT Table 1 provides a summary of the characteristics of the lis- GROUP DELAY teners with hearing loss, including the audiometric thresh- olds of the test ear. All listeners were tested monaurally. An important design objective of the frequency-warping sys- The right ear was tested in normal-hearing listeners and tem is to determine the optimal number of filter sections that in hearing-impaired listeners with symmetrical hearing loss. would give effective frequency resolution while minimizing The left ear was tested in some hearing-impaired listeners audible delay. As shown in Section 1.2, the overall group de- when the threshold configuration of the left ear allowed for lay is short enough that there should be minimal audible more optimal digital filter design for linear amplification (see interaction between the user’s own voice and the delayed below). Listeners were tested individually in a double-walled sound from the hearing aid. The data of Stone and Moore sound proof booth. Daily test sessions typically lasted one [14, 15, 16] indicate that there is a threshold of approximately hour but did not exceed two hours. Listeners were compen- 9 milliseconds for audible interference when the hearing-aid sated 9 dollars per hour for their participation. user is talking, and their experiments do not need to be du- plicated for the frequency-warped system. However, there is 3.1.2. Stimuli still a question whether the frequency-dependent delay will cause audible timbre or transient effects when listening to Test stimuli included clicks, sentences, and vowels processed to duplicate the delay effects of the frequency-warped system. speech. These stimuli were included in order to assess the percep- This issue is addressed in the present experiment by de- tual effects of group delay on stimuli ranging from impulsive termining the minimum boundary for detectible group delay (clicks) to steady-state (vowels). for impulsive sounds, for steady-state sounds, and for contin- Vowels were synthesized using Sensimetrics cascade for- uous speech. Specifically, detection thresholds for frequency- mant software (Klatt [24]) with a 16,000 Hz sampling rate dependent group delay for these stimuli were measured in a
- 3010 EURASIP Journal on Applied Signal Processing For listener presentation, the digitally stored stimuli went Table 2: Formant bandwidths and frequencies (Hz) for the vowels /i/ and /a/ for fundamental frequencies of 125 Hz and 200 Hz. through a digital-to-analog converter (TDT AP2,DD1), a 10 000 Hz antialiasing filter (TDT FT3), an attenuator (TDT /i/ /a/ Formant Bandwidth PA4), and a headphone buffer (TDT HB6). Finally, the stim- F1 90 Hz 270 Hz 730 Hz uli were presented monaurally to the test ear of each listener F2 110 Hz 2290 Hz 1090 Hz through a TDH-49 earphone. F3 170 Hz 3010 Hz 2440 Hz The system for signal presentation described above has F4 250 Hz 3350 Hz 3350 Hz its own inherent frequency-dependent group delay due to F5 the antialiasing filter. This inherent group delay will be con- 300 Hz 3850 Hz 3850 Hz stant from trial to trial and will not affect the primary ob- jective of this study, namely to determine a listener’s sen- 30 sitivity to the delay versus frequency characteristics of the warped delay line. Nevertheless, we sought to minimize the absolute delays in the system. After the stimuli were pro- 25 cessed with the delay filters, the stimuli were upsampled 120 sections from 16 000 Hz to 24 000 Hz using linear-phase filters and 20 then passed through a lowpass (cutoff 10 000 Hz) antialias- Delay (ms) ing filter. Therefore, the dominant system group delay will 15 be due to the TDH-49 headphone cutoff frequency of 6 kHz, which is consistent with the cutoff frequency of hearing 60 10 aids. 30 3.1.4. Signal levels 5 15 Normal-hearing listeners 8 0 The click stimuli all had the same total power, independent 0 1 2 3 4 5 6 7 8 of the number of delay sections. The clicks with no delay Frequency (kHz) had a peak level of 80 dB SPL. Detection thresholds for the click (with no delay) were approximately 26 dB peak SPL for Figure 7: Group delay (in milliseconds) is shown as a function of the normal-hearing listeners. Vowels and sentences were all frequency for 8, 15, 30, 60, and 120 filter sections. presented at an equalized RMS level corresponding to 65 dB SPL. and a duration of 1000 milliseconds. Two different vowels Hearing-impaired listeners (/i/ and /a/ ) were each generated with two different fun- Stimuli were amplified (through digital linear-phase filter- damental frequencies (F0 = 125 Hz and 200 Hz). Formant ing) for each individual hearing-impaired listener, approxi- frequencies of the vowels, based in part on those published mating the linear gain prescribed by the NAL-R fitting pro- by Peterson and Barney [25], are listed in Table 2. The sen- cedure (Byrne and Dillon [26]). The input levels to this am- tence stimuli were selected from the TIMIT corpus of digi- plification were as follows: a peak dB SPL of 80 dB for the tally recorded speech. Specifically, two versions of the same no-delay click stimuli and 65 dB SPL for the speech stimuli. sentence (“Don’t ask me to carry an oily rag like that.”) were included in the stimulus set. The first version was spoken by 3.1.5. Test procedure a male talker and the second version was spoken by a female talker. The just-noticeable delay (JND) was obtained in listeners us- ing a three-interval three-down one-up adaptive procedure 3.1.3. Signal processing and presentation (Levitt [27]). Each trial consisted of three 500-millisecond The stimuli were processed using a cascade of frequency- observation intervals with an interstimulus interval of 400 warping all-pass filter sections at a 16 kHz sampling rate milliseconds. Two of the three intervals on each trial con- and with delays ranging from 0 to 150 filter sections in tained a standard stimulus with no frequency-warped group one-section increments. A subset of these delays is shown delay (0 cascaded filter sections). One of the three inter- in Figure 7. After processing with the delay filters, the mid- vals on each trial contained a comparison stimulus with a dle 500-millisecond portions of the vowel stimuli were ex- frequency-warped delay, described in terms of the number of cerpted. The 500-millisecond excerpts were then used for cascaded filter sections. On each trial, the order of presenta- stimulus presentation in order to assess the steady-state ef- tion of the standard and comparison stimuli was randomized fects of the group delay. Dynamic-range compression was among the three intervals. The listener’s task was to identify not used in this study because the objective was to determine the interval with the frequency-warped group delay. Instruc- the threshold of detection for the group delay, and compres- tions presented to the listeners are provided in the appendix. sion would have audibly altered the signal envelopes. Feedback was provided after each trial.
- Frequency-Warped Compressor 3011 160 Table 3: Median JND values (in terms of filter sections) for normal-hearing (NH) listeners and hearing-impaired (HI) listen- 140 ers. The p values for between-group comparisons obtained using JND (filter sections no.) 120 the Wilcoxon-Mann-Whitney tests are also shown. 100 Group p value 80 Condition NH HI 0.072 Click 9 19 60 0.324 Sentence (M) 17 23 40 0.041 Sentence (F) 19 34 /a/ 125 Hz 0.003 20 34 87 /a/ 200 Hz 0.306 100 107 0 /i/ 125 Hz 0.016 39 114 /i/ 200 Hz 0.273 132 133 Sent. (M) Sent. (F) /i/ 125 /a/ 125 /a/ 200 /i/ 200 Click cedure had a stimulus range of 0 to 150 sections, these lis- 6 HI NH teners were unable to consistently detect group-delay effects 1 HI 7 HI of 150 sections or below. Presumably, their thresholds were 2 HI 8 HI 3 HI 9 HI greater than 150 sections. For the presentation of the data 10 HI 4 HI here, these censored thresholds have been assigned a value of 5 HI 11 HI 150. Note that the nonparametric analyses described here are robust to the exact censoring value. For example, the same Figure 8: Thresholds for detection of group delay (expressed as the results would be obtained had the censored thresholds been just-noticeable delay (JND), in terms of number of filter sections) set to a value of 200. Similarly, the medians that we present are shown for each of the seven stimulus conditions for NH listeners (open circles) and for HI listeners (filled symbols). in the tables do not depend on the censoring value. Table 3 shows the median just-noticeable delays (JNDs, described in terms of number of filter sections) for normal- hearing (NH) and hearing-impaired (HI) listeners. The me- The initial group delay of the comparison stimulus was dian threshold values are the lowest for the click condi- chosen so as to be above a listener’s delay threshold, as de- tion, intermediate for the sentences, and the greatest for the termined from an initial practice session. A large step size (5 steady-state vowels. The right column of Table 3 also shows filter sections) was used for the initial two turnarounds. A the p values for between-group comparisons obtained using small step size (2 filter sections) was used for the final ten the Wilcoxon-Mann-Whitney tests. While the median JND turnarounds. The JND for each adaptive test run was based values are greater in the HI group than in the NH group on the arithmetic mean of the final ten turnarounds. Four across all conditions, significant between-group differences estimates of the discrimination threshold were obtained for were observed in only three of the conditions (/i/ 125 Hz, /a/ each listener in each condition. The first estimate in each 125 Hz, and the sentence spoken by the female talker). The condition was part of initial practice session. The discrimi- lack of significance between groups in some conditions is nation thresholds reported below are based on the average of consistent with the large intersubject variability and the over- the threshold estimates obtained in the final three test runs. lap among listeners across subject groups. The discrimination threshold is referred to here as the just- The large variability in the HI group might be due in part noticeable difference (JND) for group delay and is described to degree of hearing loss. However, while detection thresh- in terms of number of filter sections. olds in the group of hearing-impaired listeners were signifi- cantly correlated with the pure tone average for click stimulus 3.2. Results and discussion (0.81, p < 0.05), they were not significantly correlated with any of the other stimuli. Figure 8 shows the just-noticeable delays (JNDs) for normal- The Wilcoxon signed-rank test was used to evaluate hearing listeners and hearing-impaired listeners for each of whether JND values were significantly different between con- the seven conditions. Large variability is evident across lis- ditions. All pairs of conditions were included. Table 4 shows teners and across stimulus conditions. For most listeners, de- the p values for this analysis, with adjustments for multi- tection thresholds were well below 150 filter sections across ple comparisons (Holm’s method). JND values are signifi- the seven conditions. However, it is important to note that re- cantly different in all but three pairs of stimulus comparisons: liable threshold estimates from the adaptive procedure were click versus male sentence; /i/ 125 Hz versus /a/ 125 Hz; and not obtainable from some listeners in some of the steady- state vowel conditions: listeners I2 and I6 in the /i/ 125 Hz male sentence versus female sentence. The fact that statis- tically significant differences are observed between most of condition; listeners N5, I1, I2, I6 in the /i/ 200 Hz condition; listener I2 in the /a/ 125 Hz condition, and listeners N5, I4, pairs of conditions is consistent with the idea that the detec- I6, and I9 in the /a/ 200 Hz condition. Since the adaptive pro- tion thresholds are stimulus dependent.
- 3012 EURASIP Journal on Applied Signal Processing Table 4: p values for Wilcoxon signed-rank test for all pairs of conditions, adjusted for multiple comparisons using Holm’s method. /i/ 125 Hz /i/ 200 Hz /a/ 125 Hz /a/ 200 Hz Click Sent. (F) Click — — — — — — /i/ 125 Hz 0.0012 — — — — — /i/ 200 Hz 0.0012 0.0012 — — — — /a/ 125 Hz 0.0012 0.1567 0.0012 — — — /a/ 200 Hz 0.0012 0.0287 0.0037 0.0056 — — 0.0425 0.0012 0.0012 0.0056 0.0012 Sent. (F) — 0.1567 0.0012 0.0012 0.0012 0.0012 0.7677 Sent. (M) The differences in detection thresholds across stimulus 1.0 HI conditions and across listeners may be partially explained by Male 0.8 the differential use of auditory cues in the detection task. For Click /a/ 125 example, listeners might use the delayed onset of low fre- 0.6 Fn (x) quencies relative to the high frequencies in the detection of Female 0.4 group delay for the click stimulus. Such across-channel on- /i/ 125 /i/ 200 set cues would be unavailable for the vowels, since the vowel 0.2 /a/ 200 stimuli were limited to a steady-state portion of the pro- 0.0 cessed signal. Listeners might be limited to within-channel cues (e.g., changes in the envelope structure with an au- 0 20 40 60 80 100 120 140 ditory filter). That is, the group delay may cause different JND (filter sections) phase relations among harmonics falling in the same au- (a) ditory filter, resulting in potentially audible changes in fre- quency modulation and/or amplitude modulation. These 1.0 Click within-channel cues would be expected to be most evident NH /a/ 125 Male 0.8 for vowels with lower fundamental frequencies, since the Female more closely spaced harmonics are more likely to interact /i/ 125 0.6 Fn (x) within an auditory filter. This idea is consistent with the 0.4 results showing that detection thresholds for vowels with a /a/ 200 125 Hz fundamental frequency are significantly better than /i/ 200 0.2 for the vowels with a 200 Hz fundamental frequency. The use of within- and across-channel cues would also be expected 0.0 to differ in hearing-impaired listeners, given the assumption 0 20 40 60 80 100 120 140 of broader auditory filters in listeners with cochlear hearing JND (filter sections) loss (Moore [28]). Further speculation regarding the possi- (b) ble mechanisms underlying the detection thresholds is lim- ited by the experimental design. Specific auditory cues were not parametrically varied as a function of the number of all- Figure 9: The cumulative distribution function for the group of normal-hearing listeners (b) and the group of hearing-impaired lis- pass filters. As such, listeners may have used multiple audi- teners (a) is shown for each of the seven stimulus conditions. The tory cues in the detection task, some of which may not have cumulative distribution function shows the estimate of the proba- been consistently available (e.g., the phase relations among bility (Fn(x)) that a particular JND value is detectible. Fn(x) = 0.5 the vowel harmonics may not have changed monotically as a is the median JND threshold for each listener group in each condi- function of the number of all-pass filters). tion. The primary goal of the perceptual study was to deter- mine the minimum detectible boundary for a wide range of stimuli processed with the warped compression algorithm in is the median JND threshold for each group (NH and HI) in order to guide its implementation. The objective is to deter- each of the seven conditions. The design of the warped compressor involves a trade-off mine the optimal number of filter sections that would give effective frequency resolution while minimizing audible de- between the frequency resolution and the group delay. An ad- lay. ditional practical concern is the computational load for im- Figure 9 shows the cumulative distribution functions for plementing the warped compressor in the hearing-aid digital the group of normal-hearing listeners (Figure 9b) and the processor. The number of multiply adds per second scales di- group of hearing-impaired listeners (Figure 9a). The cumu- rectly as the number of all-pass filter sections, and a practical lative distribution functions show estimates of the probabil- maximum is 31 all-pass filter sections combined with a 32- ity (Fn(x)) of a given JND value being detectible. Fn(x) = 0.5 point FFT for the frequency analysis.
- Frequency-Warped Compressor 3013 a frequency-warping system that would give effective fre- The warped compressor using 31 all-pass filter sections has a group delay equivalent to 15 sections because of the quency resolution while minimizing audible delay. A warped filter-coefficient symmetry. To address the issue of the audi- compressor design using 31 all-pass filter sections gives a bility of the delay associated with a warped compressor with delay equivalent to 15 sections in cascade when symmetric filter-coefficients are used. The maximum delay in a practi- 15 sections, it is helpful to consider an estimate of the proba- bility of the JND = 15 sections being at or above the detection cal system is just over 6 milliseconds, which is comfortably threshold. In both listener groups, the estimate of the proba- below the threshold of approximately 9 milliseconds found bility of listeners being able to detect a frequency-dependent for audible interference when the hearing-aid user is talking. group delay of 15 sections is greater than 0.4 for the click The results reported in this paper show that the frequency- stimulus. However, the probability that listeners in either dependent group delay produced by 15 sections is inaudible group will be able to detect the group delay of 15 sections de- for most listeners for the click stimuli and inaudible for all creases substantially for all other stimulus conditions. Thus, listeners for steady-state speech sounds. Thus, a warped com- a warped compressor using 31 all-pass sections should give a pressor using 31 all-pass sections should give a system with system with inaudible delay under nearly all listening condi- inaudible delay under nearly all listening conditions. tions. US, European, and other patent applications have been filed on the signal processing described in this paper (Kates [29]). 4. CONCLUSIONS Frequency warping offers definite advantages in designing a APPENDIX digital compressor. The warped frequency scale gives a much INSTRUCTIONS TO LISTENERS better match to auditory perception than the uniform fre- quency scale inherent in conventional digital signal process- Listeners were presented with the following instructions. Sig- ing. With the appropriate choice of the warping parameter, nal processing in hearing aids can help improve what we lis- the warped FFT bins closely approximate a Bark frequency ten to. Sometimes the signal processing can also make speech scale. Furthermore, using a compression filter having even sound different. We are studying how perceptible these dif- symmetry guarantees that the group delay does not depend ferences are. Throughout this study, you will be hearing dif- on the instantaneous compression gains, and thus removes ferent kinds of sounds. These sounds include (1) clicks, (2) any phase modulation that could occur as the gains change the vowel sound “ah” as in “hot,” (3) the vowel sound “ee” in response to the incoming signal and ensures that localiza- as in “heed,” and (4) the sentence “Don’t ask me to carry an tion phase cues are preserved in a binaural fitting. oily rag like that.” During any given listening set, you will The simulation results showed that a 31-tap warped FIR hear the same kind of sounds. On each trial, you will hear filter, using a 32-point warped FFT, gave frequency analysis three sounds in a row. Your task is to pick the one sound (1, results comparable to those from a 128-point conventional 2, or 3) that sounds different from the other two sounds. You FFT. Frequency warping allows a substantial reduction in the will need to wait until all three sounds have played out before system order when compared to a conventional FIR filter pressing the appropriate button. giving similar frequency resolution, requiring less than half compression-filter length. The primary disadvantage in im- plementing frequency warping is the computational cost of ACKNOWLEDGMENTS replacing unit delays with first-order all-pass filters. The all- The second author is supported by a grant from the Whitaker pass filters could conceivably double the computational time Foundation. The authors thank Jessica Rossi-Katz, Kim needed to implement an FIR filter. However, since a filter Howry, Michelle Itano, and Ajay Natarajan for their assis- only half as long is needed for performance equivalent to a tance in data collection and analysis. The authors extend conventional FIR compression filter, the net cost should be thanks to Reinier Kortekaas for providing helpful comments minimal. on an earlier draft of this paper. The frequency-warped compressor introduces a frequency-dependent group-delay characteristic. Detection REFERENCES thresholds for the delay variation with frequency were obtained for a group of normal-hearing subjects and for [1] J. M. Kates, “Signal processing for hearing aids,” in Applica- a group of hearing-impaired subjects. The subject tests tions of Digital Signal Processing to Audio and Acoustics, M. indicated that the median detection threshold for the Kahrs and K. Brandenburg, Eds., Kluwer Academic, Norwell, Mass, USA, pp. 235–277, March 1998. frequency-dependent group delay is the lowest for click [2] H. Dillon, R. Katsch, D. Byrne, T. Ching, G. Keidser, and S. stimuli, the highest for steady-state vowels, and intermediate Brewer, “The NAL-NL1 prescription procedure for non-linear for speech. Normal-hearing subjects had lower thresholds hearing aids,” Annual Rep. 1997/98, pp. 4–7, National Acous- on average than the hearing-impaired subjects, but there was tics Laboratories Research and Development, Chatswood, a large intersubject variability. NSW, Australia, 1998. The detection thresholds obtained in this study pro- [3] B. C. J. Moore and B. R. Glasberg, “Suggested formu- vide insights into the optimal number of filter sections in lae for calculating auditory-filter bandwidths and excitation
- 3014 EURASIP Journal on Applied Signal Processing patterns,” Journal of the Acoustical Society of America, vol. 74, [22] M. J. Williamson, K. L. Cummins, and K. E. Hecox, “Adap- no. 3, pp. 750–753, 1983. tive programmable signal processing and filtering for hearing [4] E. Zwicker and E. Terhardt, “Analytical expressions for aids,” US Patent 5,027,410, June 1991. critical-band rate and critical bandwidth as a function of fre- [23] G. A. Miller and P. E. Nicely, “An analysis of perceptual confu- quency,” Journal of the Acoustical Society of America, vol. 68, sions among some English consonants,” Journal of the Acous- no. 5, pp. 1523–1525, 1980. tical Society of America, vol. 27, no. 2, pp. 338–352, 1955. [5] A. V. Oppenheim, D. H. Johnson, and K. Steiglitz, “Computa- [24] D. H. Klatt, “Software for a cascade/parallel formant synthe- tion of spectra with unequal resolution using the fast Fourier sizer,” Journal of the Acoustical Society of America, vol. 67, transform,” Proc. IEEE, vol. 59, no. 2, pp. 299–300, 1971. no. 3, pp. 971–995, 1980. [6] A. V. Oppenheim and D. H. Johnson, “Discrete representation [25] G. E. Peterson and H. L. Barney, “Control methods used in a of signals,” Proc. IEEE, vol. 60, no. 6, pp. 681–691, 1972. study of the vowels,” Journal of the Acoustical Society of Amer- ica, vol. 24, no. 2, pp. 175–184, 1952. [7] J. O. Smith III and J. S. Abel, “Bark and ERB bilinear trans- [26] D. Byrne and H. Dillon, “The National Acoustic Laboratories’ forms,” IEEE Trans. Speech Audio Processing, vol. 7, no. 6, pp. (NAL) new procedure for selecting the gain and frequency re- 697–708, 1999. sponse of a hearing aid,” Ear and Hearing, vol. 7, no. 4, pp. ¨¨ ¨¨ [8] A. Harma, M. Karjalainen, L. Savioja, V. Valimaki, U. K. 257–265, 1986. Laine, and J. Huopaniemi, “Frequency-warped signal process- [27] H. Levitt, “Transformed up-down methods in psychophysics,” ing for audio applications,” Journal of the Audio Engineering Journal of the Acoustical Society of America, vol. 49, no. 2, pp. Society, vol. 48, no. 11, pp. 1011–1031, 2000. 467–477, 1971. ¨ ¨ [9] M. Karjalainen, E. Piirila, A. Jarvinen, and J. Huopaniemi, [28] B. C. J. Moore, Cochlear Hearing Loss, Whurr Publishers, Lon- “Comparison of loudspeaker equalization methods, based on don, UK, 1998. DSP techniques,” Journal of the Audio Engineering Society, [29] J. M. Kates, “Dynamic range compression using digital fre- vol. 47, no. 1-2, pp. 14–31, 1999. quency warping,” US Patent Application 20030081804, May ¨¨ [10] M. Karjalainen, A. Harma, and U. K. Laine, “Realizable 2003. warped IIR filters and their properties,” in Proc. IEEE Inter- national Conference on Acoustics, Speech, and Signal Processing (ICASSP ’97), vol. 3, pp. 2205–2208, Munich, Germany, April James M. Kates was born in Brookline, 1997. Mass, in 1948. He received the degrees [11] H. W. Strube, “Linear prediction on a warped frequency of B.S.E.E. and M.S.E.E. from the Mas- scale,” Journal of the Acoustical Society of America, vol. 68, sachusetts Institute of Technology (MIT) in no. 4, pp. 1071–1076, 1980. 1971, and the professional degree of Elec- ¨¨ [12] M. Karjalainen, A. Harma, U. K. Laine, and J. Huopaniemi, “Warped filters and their audio applications,” in Proc. IEEE trical Engineer from MIT in 1972. He cur- Workshop on Applications of Signal Processing to Audio and rently is a Senior Research Engineer in the Acoustics (WASPAA ’97), New Paltz, NY, USA, October 1997, Algorithm Development Group of GN Re- Sound. He has an office in Boulder, Colo, session 11, paper 2, 4 pages. [13] J. Agnew and J. M. Thornton, “Just noticeable and objection- where he is involved in research and devel- able group delays in digital hearing aids,” Journal of the Amer- opment of digital signal processing for hearing aids. He is also an ican Academy of Audiology, vol. 11, no. 6, pp. 330–336, 2000. Adjunct Professor in the Department of Speech, Language & Hear- [14] M. A. Stone and B. C. J. Moore, “Tolerable hearing aids delays. ing Sciences at the University of Colorado at Boulder, where he II: Estimation of limits imposed during speech production,” conducts research in auditory perception, hearing loss, and signal Ear and Hearing, vol. 23, no. 4, pp. 325–338, 2002. processing for hearing aids. Prior to moving to Boulder, he was [15] M. A. Stone and B. C. J. Moore, “Tolerable hearing aids delays. with the Center for Research in Speech and Hearing Sciences of I: Estimation of limits imposed by the auditory path alone us- the City University of New York, where he conducted research in ing simulated hearing losses,” Ear and Hearing, vol. 20, no. 3, hearing aids and auditory perception. Previous positions include pp. 182–192, 1999. research and development for hearing aids (Cirrus Logic, Audi- [16] M. A. Stone and B. C. J. Moore, “Tolerable hearing-aid delays. oLogic, and Siemens Hearing Instruments), signal processing for III. Effects on speech production and perception of across- radar, speech, and hearing applications (SIGNATRON Inc.), and frequency variation in delay,” Ear and Hearing, vol. 24, no. 2, loudspeaker design and signal processing for audio applications pp. 175–183, 2003. (Acoustic Research and CBS Laboratories). [17] J. Blauert and P. Laws, “Group delay distortions in electroa- coustical systems,” Journal of the Acoustical Society of America, Kathryn Hoberg Arehart received her B.S. vol. 63, no. 5, pp. 1478–1483, 1978. degree in biological sciences from Stanford [18] D. M. Green, “Temporal acuity as a function of frequency,” University in 1984. She received an M.S. de- Journal of the Acoustical Society of America, vol. 54, no. 2, pp. gree in 1987 and a Ph.D. degree in 1992, 373–379, 1973. both in speech and hearing sciences from H. Banno, K. Takeda, and F. Itakura, “The effect of group [19] the University of Washington in Seattle. delay spectrum on timbre,” Acoustic Science and Technology, She also has clinical certification in audiol- vol. 23, no. 2, pp. 113–116, 2002. ogy from the American Speech-Language- [20] W. H. Greer, Monaural sensitivity to dispersion in impulses and Hearing Association. In 1992, she joined the speech, Ph.D. thesis, University of Utah, Salt Lake City, Utah, faculty of the Department of Speech, Lan- USA, 1975. guage & Hearing Sciences at the University of Colorado at Boulder, [21] T. Arai and S. Greenberg, “Speech intelligibility in the pres- where she now is an Associate Professor. Her research interests in- ence of cross-channel spectral asynchrony,” in Proc. IEEE In- clude auditory perception by listeners with cochlear hearing loss ternational Conference on Acoustics, Speech, and Signal Process- and design and evaluation of signal processing algorithms for hear- ing (ICASSP ’98), vol. 2, pp. 933–936, Seattle, Wash, USA, May 1998. ing aids.
CÓ THỂ BẠN MUỐN DOWNLOAD

-
Báo cáo hóa học: " Research Article FPGA-Based Real Time, Multichannel Emulated-Digital Retina Model Implementation"
 10 p |
  43
|
43
|  8
8
-
Báo cáo hóa học: " Speckle Reduction and Structure Enhancement by Multichannel Median Boosted Anisotropic Diffusion"
11 p | 53
| 6
-

Báo cáo hóa học: " Speech Enhancement by Multichannel Crosstalk Resistant ANC and Improved Spectrum Subtraction"
10 p | 48
| 6
-

Báo cáo hóa học: " Virtual Microphones for Multichannel Audio Resynthesis Athanasios Mouchtaris"
12 p | 30
| 5
-
Báo cáo hóa học: " Research Article Multichannel ECG and Noise Modeling: Application to Maternal and Fetal ECG Signals"
14 p | 47
| 5
-
Báo cáo hóa học: " Research Article Efficient Recursive Multichannel Blind Image Restoration"
10 p | 47
| 5
-
Báo cáo hóa học: " Research Article Efficient Multichannel NLMS Implementation for Acoustic Echo Cancellation"
6 p | 50
| 5
-
Báo cáo hóa học: " Research Article Multichannel Coding of Applause Signals Gerard Hotho, Steven van de Par, and Jeroen Breebaart"
9 p | 41
| 5
-
Báo cáo hóa học: " Fast Adaptive Blind MMSE Equalizer for Multichannel FIR Systems"
17 p | 41
| 4
-
Báo cáo hóa học: " Research Article Analysis of Transient and Steady-State Behavior of a Multichannel Filtered-x Partial-Error Affine Projection Algorithm"
15 p | 55
| 4
-
Báo cáo hóa học: " Research Article Block-Based Adaptive Vector Lifting Schemes for Multichannel Image Coding"
10 p | 40
| 4
-
Báo cáo hóa học: " Research Article Postfiltering Using Multichannel Spectral Estimation in Multispeaker Environments"
10 p | 42
| 4
-
Báo cáo hóa học: " Optimized Multichannel Filter Bank with Flat Frequency Response for Texture Segmentation"
11 p | 40
| 3
-
Báo cáo hóa học: " Multichannel Baseband Processor for Wideband CDMA"
16 p | 50
| 3
-
Báo cáo hóa học: " An Evolutionary Approach for Joint Blind Multichannel Estimation and Order Detection"
9 p | 48
| 3
-

Báo cáo hóa học: " Multichannel Direction-Independent Speech Enhancement Using Spectral Amplitude Estimation Thomas Lotter"
10 p | 46
| 3
-

Báo cáo hóa học: " Multichannel SAR Interferometry via Classical and Bayesian Estimation Techniques"
14 p | 49
| 3


Chịu trách nhiệm nội dung:
Nguyễn Công Hà - Giám đốc Công ty TNHH TÀI LIỆU TRỰC TUYẾN VI NA
LIÊN HỆ
Địa chỉ: P402, 54A Nơ Trang Long, Phường 14, Q.Bình Thạnh, TP.HCM
Hotline: 093 303 0098
Email: support@tailieu.vn
Giấy phép Mạng Xã Hội số: 670/GP-BTTTT cấp ngày 30/11/2015 Copyright © 2022-2032 TaiLieu.VN. All rights reserved.

