


Báo cáo hóa học: " Rapid thermal annealing and crystallization mechanisms study of silicon nanocrystal in silicon carbide matrix"
lượt xem 5
download
 Download
Vui lòng tải xuống để xem tài liệu đầy đủ
Download
Vui lòng tải xuống để xem tài liệu đầy đủ
Tuyển tập báo cáo các nghiên cứu khoa học quốc tế ngành hóa học dành cho các bạn yêu hóa học tham khảo đề tài: Rapid thermal annealing and crystallization mechanisms study of silicon nanocrystal in silicon carbide matrix
Bình luận(0) Đăng nhập để gửi bình luận!
Nội dung Text: Báo cáo hóa học: " Rapid thermal annealing and crystallization mechanisms study of silicon nanocrystal in silicon carbide matrix"
- Wan et al. Nanoscale Research Letters 2011, 6:129 http://www.nanoscalereslett.com/content/6/1/129 NANO EXPRESS Open Access Rapid thermal annealing and crystallization mechanisms study of silicon nanocrystal in silicon carbide matrix Zhenyu Wan*, Shujuan Huang, Martin A Green, Gavin Conibeer Abstract In this paper, a positive effect of rapid thermal annealing (RTA) technique has been researched and compared with conventional furnace annealing for Si nanocrystalline in silicon carbide (SiC) matrix system. Amorphous Si-rich SiC layer has been deposited by co-sputtering in different Si concentrations (50 to approximately 80 v%). Si nanocrystals (Si-NC) containing different grain sizes have been fabricated within the SiC matrix under two different annealing conditions: furnace annealing and RTA both at 1,100°C. HRTEM image clearly reveals both Si and SiC-NC formed in the films. Much better “degree of crystallization” of Si-NC can be achieved in RTA than furnace annealing from the research of GIXRD and Raman analysis, especially in high-Si-concentration situation. Differences from the two annealing procedures and the crystallization mechanism have been discussed based on the experimental results. Introduction Many research efforts have been allocated in looking for a better dielectric material as a matrix to embed the Shockly and Queisser [1] have calculated the upper the- Si-NC. Comparing the band gap with different materials oretical efficiency limitation for on p-n junction silicon such as silicon dioxide (approximately 8.9 eV) and sili- solar cell as 30%. In order to further obtain a higher con nitride (approximately 4.3 eV), the band gap of sili- efficiency, multi-junction solar cells with different mate- con carbide (approximately 2.4 eV) is the lowest [5]. rials have been designed and fabricated [2]. However, to The small SiC bandgap increases the electron tunnelling create different band gap solar cell layers, expensive and probability. Increased carrier transportation performance perhaps toxic materials have to be involved and this is and greater current can be expected from these multi- assumed to be the main obstacle for the wide use of junction solar cells. Kurokawa et al. and M. Künle et al. multi-junction solar cell. As a result, in recent years, the theory of “all silicon multi-junction solar cell” has been [6,7] have reported the fabrication of good quality Si- NC in SiC matrix film by plasma-enhanced chemical developed [3,4], and silicon nanocrystals (Si-NCs) in var- ious dielectric materials study have gained researchers’ vapor deposition (PECVD) system. However, the main disadvantages of PECVD deposition are extremely time interests in all silicon multi-junction solar cell applica- consuming in superlattice structure and in toxic, explo- tions [5]. Due to quantum size effect, three-dimensional sive, and expensive gases involved, such as silane (SiH4), quantum-confined silicon dots have been proven to be able to tune the bandgap in a wide range by controlling monomethylsilane (MMS), methane (CH4), and hydro- the dot size. The bandgap of each cell layer can be gen (H 2 ) etc. In our group, Si-NCs in a SiC matrix adjusted by the wavelength of different light spectrum deposited by a sputtering process have been intensively and all silicon multi-junction solar cells with high effi- investigated in order to overcome the disadvantages ciency can be well expected. listed above. In our previous research, Si-NCs are fabricated by post-deposition annealing of Si-rich SiC (SRC) layer in a nitrogen furnace for a long time (more than 1 h) [8,9]. * Correspondence: z.wan@student.unsw.edu.au Both Si and SiC NC have been clearly observed in x-ray ARC Photovoltaics Centre of Excellence, University of New South Wales diffraction (XRD) and transmission electron microscopy (UNSW), Sydney, Australia © 2011 Wan et al; licensee Springer. This is an Open Access article distributed under the terms of the Creative Commons Attribution License (http://creativecommons.org/licenses/by/2.0), which permits unrestricted use, distribution, and reproduction in any medium, provided the original work is properly cited.
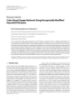
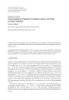
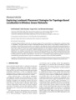
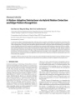
- Wan et al. Nanoscale Research Letters 2011, 6:129 Page 2 of 7 http://www.nanoscalereslett.com/content/6/1/129 voltage of 45 kV and a current of 40 mA, using Cu Ka (TEM) measurements when annealing temperature rise radiation (l = 1.5418 Å). The glancing angle of the inci- above 900°C. After annealing, SiC-NCs in beta phase (b- dent x-ray beam is optimised by omega scan and set SiC) as well as amorphous Si are found surrounding the between 0.2° and 0.4° The nanocrystal size is estimated Si-NC. Rapid thermal annealing (RTA) has been consid- using the Scherrer equation. Additional structural prop- ered as a primary annealing technique in semiconductor erties such as phase separation and crystallinity are stu- industry because of the low energy cost and better crys- died by Raman spectroscopy (Renishaw, RM2000) in tallization result [10,11] In nanocrystalline system, better backscattering configuration. The power of the Ar ion crystallization has also been reported in RTA because laser (514 nm) was reduced below 8 mW to avoid local heating of the structure is caused by light directly crystallization by laser beam. absorbed in the layers [12]. In this paper, we compare two annealing techniques: conventional furnace anneal- Results and discussion ing and RTA upon Si and SiC nanocrystalline system, and subsequently research the differences of structural TEM study characterization. By investigating the crystallization dif- Figures 1 and 2 show the plan view TEM images of the ferences, we try to explain the crystallization mechanism sample SRC50 after RTA and furnace annealing. The of Si and SiC-NC. volume percentage of Si over SiC is 50 v% from RF sputter rates of Si and SiC are calibrated by crystal thickness monitor. Both images clearly reveal the forma- Experimental details tion of NC. The NC which is circled by solid lines with The SRC films are deposited by magnetron co-sputter- a fringe spacing 3.1 Å corresponds to Si (111) lattice ing a Si and a SiC target at room temperature using a plane; and the dash-line which is circled with a fringe multi-target sputtering machine (AJA International, spacing of 2.5 Å corresponds to the lattice plane of ATC-2200, North Scituate, MA, USA). Radio frequency b -SiC (111) [8]. The nanocrystal size and shape (RF, 13.56 MHz) power supplies are connected to the are similar in both annealing conditions, with Si size targets. The Si concentration in the SRC films is con- 6-7 nm and SiC size 2-3.5 nm. trolled by adjusting the RF supply power connected to the Si target. The base pressure of the main chamber of deposition was 8.0 × 10⁻⁷ Torr and the working pressure X-ray diffraction investigation is 2.0 × 10⁻³ Torr. Table 1 includes the sample details The crystalline properties of samples annealed by RTA reported in this paper. and furnace are studied by XRD. Figure 3 shows a wide After deposition, either furnace or RTA annealing is scan XRD curve of the sample SRC60 annealed by fur- carried out for the purpose of Si precipitation from the nace. The Bragg peaks can be assigned to cubic Si nano- crystal as well as b -SiC nanocrystal, as shown by the matrix. The furnace annealing is processed in nitrogen (N2) ambient at 1,100°C for 1 h with 40 min ramping- indexes in the graph. This suggests the formation of both Si and b -SiC-NC which is consistent to TEM up time from 500°C to 1,100°C. The RTA annealing is results. also processed in N2 ambient at 1,100°C, but with a very Figure 4 compares the XRD spectra of the samples short ramping time of 45 s in the same temperature with different Si concentrations after 1,100 C annealing. range and much shorter annealing time of 2 min. All the annealed samples show clear Bragg peaks from A detailed temperature ramping profile is listed in Table 2. Si and b-SiC crystallization. In addition, the intensity of The structural properties including the nanocrystal Si Bragg peak increases while the SiC peak decreases size, shape, and phase separation are studied using TEM with the increasing of Si concentration. This phenom- (Phillips CM200) at 200 kV. The crystalline properties are evaluated by grazing incidence XRD using a Philips’s enon can be explained by more amorphous silicon (a-Si) X ’ Pert Pro material research diffraction system at a is involved in precipitation and crystallization, as a result, higher crystallization volume of crystallized-Si can be achieved. This reason can also be used to explain Table 1 Sample names and deposition conditions SiC peaks: when Si concentration increase, SiC concen- Sample Silicon-rich Sample structure/thickness tration decreases, and the volume of SiC crystallinity name concentration (nm) (volume percentage v decreases due to less available a-SiC. %) It should be noted that there is no Bragg peak of SRC80 80 Single layer/approximately 600 b-SiC phase detected from a sputtered stoichiometric SRC70 70 Single layer/approximately 600 SiC film, indicating that SiC film does not crystallize SRC60 60 Single layer/approximately 600 under 1,100°C annealing condition itself due to insuffi- SRC50 50 Single layer/approximately 600 cient kinetic energy [13]. That both Si and SiC-NC SiC 0 Single layer/approximately 600 appear in silicon-rich carbide samples could be due to
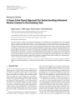
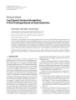
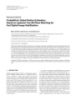
- Wan et al. Nanoscale Research Letters 2011, 6:129 Page 3 of 7 http://www.nanoscalereslett.com/content/6/1/129 Table 2 Temperature ramping profile for conventional furnace annealing and RTA Room temperature, 500°C to 900°C to 1,100°C approximately 500°C approximately 900°C approximately 1,100°C Conventional furnace annealing N/A 25 min 15 min 60 min RTA 15 min 30 s 15 s 2 min which is calculated from formula (1) also tends to the Si inducement. Some researchers reported sputtered increase. But the change is not significant until the Si Si starts to crystallize at 900°C [14]. Si and SiC-NC concentration reaches 60 v% and grain size in furnace could be observed after annealing at 900°C in our pre- annealing samples tends to increase faster in high Si vious research [8,9]. From these results, we propose that concentration (>70 v%). The same trend can also be at annealing temperatures of 900°C, the formation of Si- observed in SiC-NC, the grain size of SiC crystal start to NC [8], act as nuclei for SiC nanocrystal growth. As a decrease when Si concentration falls below 60 v%. result, both Si and SiC diffraction peaks could be The degree of Si crystallization can be estimated by observed in silicon-rich carbide samples while no SiC the relative intensity of XRD peaks [15]. Figures 6 and 7 peak observed in sputtered stoichiometric SiC film. compare the RTA and the furnace annealing samples in The full width at half maximum (FWHM) of each different concentration. The relative intensity of two Si XRD peak were carefully measured, and the nanocrystal peaks (at 28.4°) is almost the same under low Si concen- size was calculated by Scherr formula, tration at 50 v% (Figure 6). The intensity difference G = k / Δ(2 ) cos changes significantly when Si concentration increased to (1) 80 v% (Figure 7). However, the difference of SiC peak where l is the wavelength of the X-rays, θ is the Bragg intensity barely changes in both Si concentrations. diffraction angle at the peak position in degrees, Δ(2θ) is We then further measure the intensity of Si peak from the FWHM in radian, and k is a correction factor. The XRD result carefully as shown in Figure 8. Under low Si value of k is usually chosen to be 0.9 for Si films. Nano- concentration range (50 and 60 v%), Si peak intensity of samples annealed by either RTA or furnace are almost crystal sizes from RTA and furnace annealing samples the same. The intensity of RTA samples increased dra- are calculated by this formula and are indicated and matically to two to three times higher compared to the compared in Figure 5. furnace annealing samples when Si concentration In both RTA and furnace annealing samples, we can increased above 60 v%. see that when Si concentration increases, Si grain size Figure 1 HRTEM plan view of image of SRC50 sample annealed Figure 2 Cross-section TEM image of SRC50 sample annealed by RTA. by furnace.
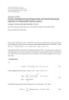
- Wan et al. Nanoscale Research Letters 2011, 6:129 Page 4 of 7 http://www.nanoscalereslett.com/content/6/1/129 Figure 3 Wide scan XRD curve of the sample SRC60 annealed Figure 5 Si and SiC grain size from RTA and furnace annealing by furnace. in different Si concentration. concentration increases, higher degree of silicon crystalli- Raman investigation Figure 9 shows Raman spectrum of furnace annealed zation and less residual amorphous Si tend to be observed. SRC60 sample. As we can see, the peak within the range Meanwhile, the samples from RTA show higher degree of of 400 to 600 cm -1 can be de-convoluted to two main Si crystallization in the matrix, comparing to the furnace components: the peak centred at approximately 511 cm-1 annealing, especially in high Si concentration level. corresponds to Si nanocrystal phase and the peak centred at approximately 480 cm-1 corresponds to the amorphous Discussion of structural difference and crystallization Si phase [6]. The hump at 400 cm-1 may be assigned as mechanism partial breakdown of Raman selection rules [16]. Mean- RTA is considered as a positive annealing method in Si/ while, two small SiC peaks are also observed at approxi- SiC nanocrystalline system compared with furnace mately 800 and 940 cm-1 attributed to the TO and LO of annealing. For the purpose of quantitative investigation, cubic and hexagonal SiC poly types [17,18]. we calculate the degree of crystallization in all Si con- The degree of crystallization of Si nanocrystal could also centration range by comparing the RTA and furnace value ratio (DRTA/Dfurance) from the result of both XRD be evaluated by calculating the intensity ratio of the crys- talline Si peak and amorphous Si peak: IC-Si/Ia-Si [6]. Figure Si peak intensity (Figure 8) and Raman peak intensity 10 shows the relation of Si peak intensity ratio and silicon ratio (Figure 10). concentration in the SRC layers. The results indicate, for As shown in Table 3, from XRD analysis, the ratio both RTA and furnace annealing conditions, when Si remains at 1 when Si concentration is low (50-60 v%). Figure 4 XRD curves of the samples with different Si Figure 6 XRD curve comparison of SRC50 sample by RTA and concentrations after furnace annealing. furnace annealing.
- Wan et al. Nanoscale Research Letters 2011, 6:129 Page 5 of 7 http://www.nanoscalereslett.com/content/6/1/129 Figure 9 Raman spectrum of SRC60 after furnace annealing. Figure 7 XRD curve comparison of SRC80 sample by RTA and furnace annealing. 1. Si-NC have not reached nucleation equilibrium in RTA In classical theory of nucleation [19], free energy related The value comes to 2.4 under 70 v% Si concentrations to the formation of nanocrystal with radius r in an and 2.8 under 80 v% Si concentrations. From Raman amorphous matrix can be described as: analysis, we can see the ratio stays also around 1 when in low Si concentration range (50-60 v%), and 2.2 in 70 ΔG total = 4/3 r 3ΔG phase + 4 r 2 (2) v% Si concentration and 2.6 in 80 v% Si concentration. The Si degree of crystallization ratio behaves in a Here, ΔGtotal is the difference in free energy between similar overall increase trend from both XRD and the nanocrystal phase and the matrix phase, and g is the Raman results. It ’ s further confirmed that better Si interface energy, ΔGphase is the difference in free energy nanocrystal crystallization could be obtained from RTA between the nanocrystal phase and the matrix phase. since more Si-NC are formed and less amorphous Si For negative ΔGphase, the critical nanocrystal size remained, especially under high Si concentration. There are two possible crystal mechanisms to explain -2 r* = the main structural difference coming from RTA and (3) ΔG phase furnace annealing procedure as we discussed above: Figure 8 Si peak intensity of different Si concentration by RTA Figure 10 Calculated Si peak intensity ratios ( I C-Si / I a-Si ) in and furnace annealing. different Si concentration.
- Wan et al. Nanoscale Research Letters 2011, 6:129 Page 6 of 7 http://www.nanoscalereslett.com/content/6/1/129 Table 3 Degree of crystallization from RTA and furnace annealing in all Si concentration Si concentration Si Concentration Si Concentration (50 to approximately 60 v%) (70 v%) (80 v%) ++Degree of crystallization: DRTA/Dfurance (from XRD) 1 2.4 2.8 Degree of crystallization: DRTA/Dfurnace (from Raman) 1 2.2 2.6 When r r *, the NC must Si and SiC-NC were observed by TEM in both furnace grow in size to reduce the total free energy until they and RTA annealed at 1,100°C. SiC-NC are believed to reach equilibrium. be induced by Si nuclei from XRD spectra analysis. In our situation, obtaining reliable g is extremely diffi- Meanwhile, when silicon concentration raised from 50 cult, but J. K. Bording’s group predicted the r* theoretically to 80 v%, increased size of Si nanocrystal (from 6 nm to to be about 2 nm [20] for crystals and this value matches 10 to approximately 12 nm) are observed but SiC nano- well with all our measured average SiC-NC size value in crystal size remains same (2 to approximately 4 nm). Figure 5. Basing on this theory, we may conclude, espe- Compared with furnace annealing, RTA samples cially in high Si concentration, Si-NC may have not reveal a better degree of crystallization on Si nanocrystal reached the equilibrium before the annealing temperature and less amorphous Si residual. More Si-NCs are (1,100°C) drops in RTA. So, Si-NC whose grain size less is detected by XRD and Raman analysis for this approach. than 2 nm may have not completely vanished, thus more This could possibly be explained by Si-NC not reaching Si-NCs would be observed. The grain size increase trend nucleation equilibrium in the RTA or that less SiC-NC in Figure 5 can further prove this point, we can see in high are present during the ramping-up period which Si concentration region (70-80 v%) the Si grain size in increases Si-NC crystallization at high temperatures. RTA is smaller than furnace. This means Si-NCs in RTA could still grow up compare with samples of same Si con- centration in furnace, which indicates Si-NC have not Acknowledgements The authors thank other members of the Third Generation Group at the ARC reached the equilibrium in RTA. Photovoltaics Centre of Excellence for their contributions to this project. This 2. Less SiC-NC pre-existed during ramping-up period before work was supported by the Australian Research Council ARC via its Centres of Excellence scheme. Si nanocrystal grow fast at high temperature This explanation relies on the crystallization sequence. Authors’ contributions For both annealing techniques, the peak annealing tem- ZW designed and carried out all the experiments as well as the article writing. SH produced all the TEM images. SH, MAG and GC all offered peratures (1,100°C) are the same, however the duration significant financial and technical support throughout the whole project. of temperature raise (from 500-1,100°C) is different. For the RTA system, it takes 45 s to increase but 40 min are Competing interests The authors declare that they have no competing interests. needed to ramp up in furnace annealing situation. We believe the time period of temperature ramping up is Received: 10 November 2010 Accepted: 10 February 2011 crucial to Si crystallization process. From the result of Si Published: 10 February 2011 degree of crystallization, much larger quantity of Si-NC References are observed in RTA, which means Si-NC can be crystal- 1. Shockley W, Queisser HJ: Detailed balance limit of efficiency of p-n lized better in short ramping time situation. It may be junction solar cells. Journal of Applied Physics 1961, 32(3):510-519. because of the existence of SiC-NC before Si nanocrystal 2. King RR, Law DC, Edmondson KM, Fetzer CM, Kinsey GS, Yoon H, Sherif RA, Karam NH: 40% efficient metamorphic GaInP/GaInAs/Ge multijunction fast grows. As discussed earlier, Si nanocrystal start to solar cells. Applied Physics Letters 2007, 90(18):183516. form around 900°C, meanwhile, SiC-NC are induced to 3. Conibeer G, Green M, Cho EC, König D, Cho YH, Fangsuwannarak T, crystallize. Short ramping-up time in RTA may lead to Scardera G, Pink E, Huang Y, Puzzer T, Huang S, Song D, Flynn C, Park S, Hao X, Mansfield D: Silicon quantum dot nanostructures for tandem less SiC nanocrystal before 1,100°C. As soon as the tem- photovoltaic cells. Thin Solid Films 2008, 516(20):6748-6756. perature rise up to Si fast crystallization point at 1,100°C, 4. Conibeer G, Green M, Corkish R, Cho Y, Cho EC, Jiang CW, more Si-NC could be formed in RTA due to the Fangsuwannarak T, Pink E, Huang Y, Puzzer T, Trupke T, Richards B, Shalav A, Lin KL: Silicon nanostructures for third generation photovoltaic decrease in SiC-NC. solar cells. Thin Solid Films 2006, 511-512:654-662. 5. Jiang C, Green MA: Silicon quantum dot superlattices: Modeling of Conclusion energy bands, densities of states, and mobilities for silicon tandem solar cell applications. Journal of Applied Physics 2006, 99(11):114902. Si-rich SiC (SRC) layers with various Si concentrations 6. Kurokawa Y, Miyajima S, Yamada A, Konagai M: Preparation of were prepared by co-sputtering Si and SiC targets. Fur- nanocrystalline silicon in amorphous silicon carbide matrix. Japanese nace annealing and RTA techniques were compared by Journal of Applied Physics Part 2: Letters 2006, 45:37-41.
- Wan et al. Nanoscale Research Letters 2011, 6:129 Page 7 of 7 http://www.nanoscalereslett.com/content/6/1/129 7. Künle M, Hartel A, Löper P, Janz S, Eibl O: Preparation Of Si-Quantumdots In Sic: Single Layer Vs Multi Layer Approach. 24th European Photovoltaic Solar Energy Conference Hamburg, Germany; 2009. 8. Song D, Cho EC, Conibeer G, Huang Y, Flynn C, Green MA: Structural characterization of annealed Si1-x Cx/SiC multilayers targeting formation of Si nanocrystals in a SiC matrix. Journal of Applied Physics 2008, 103(8):83544. 9. Song D, Cho EC, Cho YH, Conibeer G, Huang Y, Huang S, Green MA: Evolution of Si (and SiC) nanocrystal precipitation in SiC matrix. Thin Solid Films 2008, 516(12):3824-3830. 10. Wang Y, Liao X, Ma Z, Yue G, Diao H, He J, Kong G, Zhao Y, Li Z, Yun F: Solid-phase crystallization and dopant activation of amorphous silicon films by pulsed rapid thermal annealing. Applied Surface Science 1998, 135(1-4):205-208. 11. Szekeres A, Gartner M, Vasiliu F, Marinov M, Beshkov G: Crystallization of a- Si:H films by rapid thermal annealing. Journal of Non-Crystalline Solids 1998, 227-230(Part 2):954-957. 12. Arguirov T, Mchedlidze T, Kittler M, Rolver R, Berghoff B, Forst M, Spangenberg B: Residual stress in Si nanocrystals embedded in a SiO[sub 2] matrix. Applied Physics Letters 2006, 89(5):053111. 13. Schmidt H, Fotsing ER, Borchardt G, Chassagnon R, Chevalier S, Bruns M: Crystallization kinetics of amorphous SiC films: Influence of substrate. Applied Surface Science 2005, 252(5):1460-1470. 14. Rüther R, Livingstone J, Dytlewski N: Large-grain polycrystalline silicon thin films obtained by low-temperature stepwise annealing of hydrogenated amorphous silicon. Thin Solid Films 1997, 310(1-2):67-74. 15. Carvalho AP, Brotas de Carvalho M, Pires J: Degree of crystallinity of dealuminated offretites determined by X-ray diffraction and by a new method based on nitrogen adsorption. Zeolites 1997, 19(5-6):382-386. 16. Zi J, Büscher H, Falter C, Ludwig W, Zhang K, Xie X: Raman shifts in Si nanocrystals. Applied Physics Letters 1996, 69(2):200-202. 17. Kuenle M, Janz S, Eibl O, Berthold C, Presser V, Nickel KG: Thermal annealing of SiC thin films with varying stoichiometry. Materials Science and Engineering: B 2009, 159-160:355-360. 18. Nakashima S, Harima H: Raman investigation of SiC polytypes. Physica Status Solidi (A) Applied Research 1997, 162(1):39-64. 19. Riabinina D, Durand C, Margot J, Chaker M, Botton GA, Rosei F: Nucleation and growth of Si nanocrystals in an amorphous Si O2 matrix. Physical Review B 2006, 74(7):075334. 20. Bording JK, Taftø J: Molecular-dynamics simulation of growth of nanocrystals in an amorphous matrix. Physical Review B 2000, 62(12):8098. doi:10.1186/1556-276X-6-129 Cite this article as: Wan et al.: Rapid thermal annealing and crystallization mechanisms study of silicon nanocrystal in silicon carbide matrix. Nanoscale Research Letters 2011 6:129. Submit your manuscript to a journal and benefit from: 7 Convenient online submission 7 Rigorous peer review 7 Immediate publication on acceptance 7 Open access: articles freely available online 7 High visibility within the field 7 Retaining the copyright to your article Submit your next manuscript at 7 springeropen.com
CÓ THỂ BẠN MUỐN DOWNLOAD

-
Báo cáo hóa học: "Research Article Detecting and Georegistering Moving Ground Targets in Airborne QuickSAR via Keystoning and Multiple-Phase Center Interferometry"
 11 p |
  116
|
116
|  7
7
-
Báo cáo hóa học: "Research Article Are the Wavelet Transforms the Best Filter Banks for Image Compression?"
7 p | 120
| 7
-
Báo cáo hóa học: " Research Article Practical Quantize-and-Forward Schemes for the Frequency Division Relay Channel"
11 p | 114
| 6
-
Báo cáo hóa học: " Research Article Breaking the BOWS Watermarking System: Key Guessing and Sensitivity Attacks"
8 p | 104
| 6
-
Báo cáo hóa học: " Research Article A Fuzzy Color-Based Approach for Understanding Animated Movies Content in the Indexing Task"
17 p | 108
| 6
-
Báo cáo hóa học: "Research Article Cued Speech Gesture Recognition: A First Prototype Based on Early Reduction"
19 p | 116
| 6
-

báo cáo hóa học:" Recombinant bromelain production in Escherichia coli: Process optimization in shake flask culture by Response Surface Methodology"
34 p | 96
| 6
-
Báo cáo hóa học: "Research Article Color-Based Image Retrieval Using Perceptually Modified Hausdorff Distance"
10 p | 97
| 5
-

Báo cáo hóa học: " Yeast expressed recombinant Hemagglutinin protein of Novel H1N1 elicits neutralising antibodies in rabbits and mice"
29 p | 76
| 5
-
Báo cáo hóa học: " Research Article Some Geometric Properties of Sequence Spaces Involving Lacunary Sequence"
8 p | 94
| 5
-
Báo cáo hóa học: "Research Article Exploring Landmark Placement Strategies for Topology-Based Localization in Wireless Sensor Networks"
12 p | 118
| 5
-
Báo cáo hóa học: " Research Article A Motion-Adaptive Deinterlacer via Hybrid Motion Detection and Edge-Pattern Recognition"
10 p | 93
| 5
-
Báo cáo hóa học: "Research Article Probabilistic Global Motion Estimation Based on Laplacian Two-Bit Plane Matching for Fast Digital Image Stabilization"
10 p | 112
| 4
-

báo cáo hóa học:" Sparse correlation matching-based spectrum sensing for open spectrum communications"
43 p | 74
| 4
-
Báo cáo hóa học: "Research Article On the Generalized Favard-Kantorovich and Favard-Durrmeyer Operators in Exponential Function Spaces"
12 p | 102
| 4
-
Báo cáo hóa học: " Research Article Hilbert’s Type Linear Operator and Some Extensions of Hilbert’s Inequality"
10 p | 77
| 4
-
Báo cáo hóa học: "Research Article Quantification and Standardized Description of Color Vision Deficiency Caused by"
9 p | 120
| 4
-
Báo cáo hóa học: " Cytopathic Mechanisms of HIV-1"
22 p | 78
| 4


Chịu trách nhiệm nội dung:
Nguyễn Công Hà - Giám đốc Công ty TNHH TÀI LIỆU TRỰC TUYẾN VI NA
LIÊN HỆ
Địa chỉ: P402, 54A Nơ Trang Long, Phường 14, Q.Bình Thạnh, TP.HCM
Hotline: 093 303 0098
Email: support@tailieu.vn
Giấy phép Mạng Xã Hội số: 670/GP-BTTTT cấp ngày 30/11/2015 Copyright © 2022-2032 TaiLieu.VN. All rights reserved.

