


Báo cáo hóa học: " Research Article Selection of Nonstationary Dynamic Features for Obstructive Sleep Apnoea Detection in Children"
lượt xem 7
download
 Download
Vui lòng tải xuống để xem tài liệu đầy đủ
Download
Vui lòng tải xuống để xem tài liệu đầy đủ
Tuyển tập báo cáo các nghiên cứu khoa học quốc tế ngành hóa học dành cho các bạn yêu hóa học tham khảo đề tài: Research Article Selection of Nonstationary Dynamic Features for Obstructive Sleep Apnoea Detection in Children
Bình luận(0) Đăng nhập để gửi bình luận!
Nội dung Text: Báo cáo hóa học: " Research Article Selection of Nonstationary Dynamic Features for Obstructive Sleep Apnoea Detection in Children"
- Hindawi Publishing Corporation EURASIP Journal on Advances in Signal Processing Volume 2011, Article ID 538314, 10 pages doi:10.1155/2011/538314 Research Article Selection of Nonstationary Dynamic Features for Obstructive Sleep Apnoea Detection in Children L. M. Sepulveda-Cano,1 E. Gil,2 P. Laguna,2 and G. Castellanos-Dominguez1 1 Grupo de Procesamiento y Reconocimiento de Se˜ aales, Universidad Nacional de Colombia, Km. 9, V´a al Aeropuerto, n ı Campus La Nubia, 17001000 Manizales, Colombia 2 Communications Technology Group (GTC), Arag´n Institute of Engineering Research (I3A), ISS, University of Zaragoza, CIBER-BBN, o Mar´a de Luna 1, 50018 Zaragoza, Spain ı Correspondence should be addressed to L. M. Sepulveda-Cano, lmsepulvedac@bt.unal.edu.co Received 1 July 2010; Revised 6 December 2010; Accepted 26 January 2011 Academic Editor: Antonio Napolitano Copyright © 2011 L. M. Sepulveda-Cano et al. This is an open access article distributed under the Creative Commons Attribution License, which permits unrestricted use, distribution, and reproduction in any medium, provided the original work is properly cited. This paper discusses the methodology for selecting a set of relevant nonstationary features to increase the specificity of the obstructive sleep apnea detector. Dynamic features are extracted from time-evolving spectral representation of photoplethysmography envelope recordings. In this regard, a time-evolving version of the standard linear multivariate decomposition is discussed to perform stochastic dimensionality reduction. For training aim, this work analyzes the concrete set comprising filter banked dynamic features that include spectral centroids, the cepstral coefficients as well as their time- variant energies. Performance of classifier accuracy is provided for the collected polysomnography recordings of 21 children. Moreover, since the apnea diagnosing is based on analysis of set of fragments partitioned from the photoplethysmography envelope recordings, a new approach for their indirect labeling is described. As a result, performed outcomes of accuracy bring enough evidence that if using a subset of cepstral-based dynamic features, then patient classification accuracy can reach as much as 83.3% value, when using a k-nn classifier, as well. Therefore, photoplethysmography-based detection provides an adequate scheme for obstructive sleep apnea diagnosis. 1. Introduction in the amplitude fluctuations of PPG have shown their utility for OSA diagnosis [2–4]. Regarding the diagnosis of obstructive sleep apnea (OSA) Nonetheless, since there is a large number of situation when PPG enveloped is affected independently of the apnoea syndrome, which is characterized by recurrent airflow obstruction caused by total or partial collapse of the upper status, then, a low ratio sensitivity/specificity is accom- airway, several strategies have been developed to decrease the plished. Therefore, to better discriminate between apnoea number of the sleep recordings needed for usually performed from other PPG envelop alterations an improved set of rep- polysomnography [1] that is related as an expensive and resenting features should be taken into account, particularly, time-consuming procedure. One promising alternative is stochastic modeling of dynamic features for OSA detection is the pulse photoplethysmography signal (PPG) that is a to be further considered in this work. simple, but useful, method for measuring the pulsatile The use of stochastic modeling, when taking into component of the heartbeat. PPG measurement evaluates account evolution of random biological variables along time peripheral circulation, and is tie related either to arterial (herein referred as dynamic features) precedes the necessity vasoconstriction or vasodilatation generated by the auto- of building a proper methodology of their processing. nomic nervous system, being modulated by the heart cycle. Furthermore, it is well known that the complexity of Furthermore, automatic detection of time-variant decreases stochastic modeling increases because of need to carry out
- 2 EURASIP Journal on Advances in Signal Processing the adequate nonstationary estimation of parameters derived the time axis, which is assumed to maximize the measure from biosignal recordings. One can refer to that issue as of relevance present in the nonstationary features by their the most important difference between static and dynamic projection onto a new space. For a dimension reduction, statistical processing. statistical latent variable techniques can be applied, for As a rule, methodology for analysis of time series is example, by using Principal Component Analysis (PCA) based on the assumption that there is always a processing that maximizes the variability on the input data set. This time window of such a length that the piecewise stationary- specific and unique property of PCA makes the station- based approach of analysis holds. Although determination ary signals easy to interpret. But standard latent variable of proper stationary data length remains as an open issue. techniques clearly do not take into consideration the time- With this in mind, the time-frequency representation (TFR) evolving nature of random biological variables, since they are has been proposed before for the analysis of nonstationary grounded on a common representation that minimizes the biomedical data. Among the most popular TFR used to global reconstruction error. investigate the dynamic properties of the time-evolving The aim of this study is to select a set of relevant spectral parameters, during either transient physiological nonstationary features, extracted from t - f representation or pathological episodes, are those computed directly from of time-dependant PPG envelope signals, to increase the the raw data after preprocessing, termed nonparametric specificity in the apnoea detector. This work analyzes the approaches. Specifically, the Wavelet Transform (WT) and he set comprising filter banked dynamic features that includes spectral centroids as well as the cepstral coefficients. Specif- Short Time Fourier Transform (STFT) are commonly used. Though the former TFR is likely to avoid the t - f resolution ically, a time-evolving version of the standard linear multi- compromise, the latter nonparametric approach is desirable variate decomposition is discussed throughout this paper to for biosignals with a slow time varying spectrum [5], as it perform stochastic dimensionality reduction of the dynamic is the case for PPG recordings. However, the application of features in hand. The rest of the paper is organized as TFR to the analysis of short transient signals (like in case follows: Section 2 introduces materials and methods focused of PPG envelope) is a complex, and difficult task due to on generation of nonstationary features, extracted from the inherent limitations of the TFR techniques for extracting t - f representation of time-dependant PPG envelope signals. the relevant, but not redundant characteristics. In other Also, the proposed methodology of stochastic training is words, without accurate models to describe properly the evaluated using real PPG recordings. The attained results dynamic behavior of PPG envelope biosignals, the use of are discussed in Section 5. Finally, Section 6 presents the t - f processing methods, based on stochastic assumptions, conclusions and discusses some possibilities for future work. may fail to provide satisfactory results. In this sense, it has been established the discriminating capability of frequency 2. Materials and Methods bands of biological activity between normal and pathological patterns, and for that reason, the set of TFR-based stochastic 2.1. Generation of Enhanced Dynamic Features. The PPG features to be considered should be suitable estimated by envelope, y (t ), is estimated based on the root mean square time-evolving spectral subband methods. series of input PPG signal, yPPG (t ). So, the discrete version of Nonetheless, the amount of measured time-variant fea- PPG envelope, after mean removal by a moving average filter, tures can be large, no mentioning that the sampling rate can be written as follows [2]: used for these measurements may be also high. Assuming that dynamic variables are low-pass processes, then the ⎛ ⎞2 enclosed information within the stochastic data becomes n k 1 ⎝ yPPG (k) − 1 yPPG (l)⎠ , highly correlated. This fact provides large data-sets holding y (n) = N k=n−(N −1) M l=k−( M −1) big amount of redundancy, which in turn leads to either overtraining data or significant increasing of computational (1) overhead. In such a situation, dimension reduction that should be strongly considered might determine the adequate where the values for the window length of the filtering, M , number of relevant features to select either by encoding or and the root mean square series, N , are fixed to be 25 and removing both redundant and irrelevant information. Fur- twice the mean cardiac cycle, respectively. thermore, the concept of biosignal interpretation becomes Generally, a direct way of describing the PPG envelope, critical, whose ultimate goal is the proper classification of the y (t ), in both time and frequency (t - f ) domains becomes its features, but also to depict them in order to maximize correct time-evolving spectral representation. Thus, for estimating interpretation and physiological or clinical meaning [6]. TFR of random signals, power spectral density is commonly Extraction of relevant stochastic information from used, which for a given biosignal, y (t ), is directly represented dynamic feature sets has been discussed in the past, as a by the spectrogram: means to improve performance during and after training in learning processes. Thus, to get an effective feature selection algorithm, in the context of an inference, two main issues 2 y (τ )φ(τ − t )e− j 2π f τ dτ , S y t, f = are to be overcame [7]: the same measure associated to a T (2) given relevance function (i.e., a proper measure of distance + t, τ ∈ T , S y t, f ∈ R . for time series), and the multivariate transformation through
- EURASIP Journal on Advances in Signal Processing 3 Supported on classical Fourier Transform, the Short Time information is maximally preserved. Besides, as the relevance function, g ∈ R , the evaluation measure of transformation version (termed STFT) introduces a time localization con- is given that distinguishes variables effectively representing cept by using a tapering window function of short duration, φ, that is, going along the studied biosignal, y (t ). the subjacent physiological phenomena, termed relevant Extracted from the spectrogram-based TFR, any stochas- stochastic features. tic feature x(t ) refers to random numeric values comprising The set of stochastic features, {xi }, is represented by the measures evolving over time, that is, there is a certain set of observation assemble comprising N objects that are disposed parameters, Ξ = {xi = xi (t ): i = 1, . . . , p}, that are changing in the input observation matrix XΞ = [ X1 |· · ·|Xi |· · ·|XN |]. along the time axis, t ∈ T , is supposed to carry temporal In turn, every object, denoted as Xi , i = 1, . . . , N , information of the nonstationary biosignals. In this regard, is described by the respective observation set of time- some nonparametric TFR-based dynamic measures have variant arrangements, {x ji ⊂ Ξ, j = 1, . . . , p}, such that, been widely accepted, mainly, those estimated by spectral Xi = [|x1i |· · ·|x ji |· · ·|x pi |] , Xi ∈ R p×T , where x ji = subband methods, when efficiently combining frequency and [x ji (1) · · · x ji (t ) · · · x ji (T )] is each one of the measured magnitude information from the short-term power spec- or estimated short-term features from biosignal recordings, trum of the input biosignals. For instance, given a discrete equally sampled evolving through the time, and being xi j (t ), time series, y (n), being the sampled version of a continuous the j th stochastic feature for the ith object upon a concrete t biosignal recording y (t ), the set of Linear Frequency Cepstral instant of time. Coefficients (LFCC) is proposed to be employed, which is For the sake of simplicity, the reduction dimension is extracted by Discrete Cosine Transform of triangular log- developed when projecting by the simplest time-evolving filter banks, {Fm (k): m = 1, . . . , nM }, linearly spaced in the latent variable approach, that is, time-adapted PCA. So, frequency domain: given the observation matrix, XΞ , there will be a couple of orthonormal matrixes, U ∈ RN ×N , V ∈ R pT × pT , plus diago- nM 1π xn (l) = log(sm (l)) cos n m − nal matrix ΣX , as well, so that a simple linear decomposition , (3) 2p m=1 takes place, that is, XΞ = UΣX V , where ΣX ∈ R pT × pT holds first ordered q as most relevant eigenvalues of matrix XΞ , where p is the number of desired LFCC features to be ν1 ν2 , . . . , νq νq+1 , . . . , ν pT 0, that implies the considered, and sm (l) is the weighted sum of each frequency relevance measure to be considered. The minimum mean filter response set, sm (l) = n=1 S y (l, k)Fm (k), with m, l, and K k squared-based error is assumed as the evaluation measure k being the indexes for filter ordinal, time, and frequency of transformation, g (XΞ , Z) ∼ min E { Ξ − Z 2 }, (where axes, respectively; nK stands for the number of samples in · 2 is the norm squared value, and E {·} is the is the the frequency domain. Other effective way of generating t - f - expectance operator), that is, maximum variance is preferred based time-variant features is achieved through computation as relevance measure, when the following estimation of of the histograms of the subband spectral centroids that are covariance matrix is carried out: estimated for each filter in the frequency domain, Fm (k), by cov{XΞ } = XΞ XΞ = VΣ2 V . (6) γ nK k=1 kFn (k )S y (l , k ) X xn (l) = , (4) γ nK k=1 Fn (k )S y (l , k ) To make clear the contribution of each time-variant value xi j (t ), expression (6) can be further extended in the form: where γ is a parameter representing the dynamic range of the spectrum that is used for computation of the centroid. p ν2 V j V j , XΞ XΞ = (7) The filters Fn (k) are linearly distributed along the spectrum. j j =1 In addition, the energy around each centroid can be also considered as time-variant feature that for a fixed bandwidth where V j is the j th column of matrix V. Δk is computed by means of Consequently, the amount of relevance captured at every moment t by the singular value decomposition, that is xn (l)+Δk xn (l) = associated to the whole set of features is assessed as the S y (l, k), (5) following time-variant relevance measure: k=xn (l)−Δk q where xn (l) is the actual value of the time-variant centroid ν2 V j . g (XΞ , Z; t ) = (8) that is estimated by (4). j j =1 2.2. Relevance Analysis of Stochastic Features. Because of Therefore, the proper selection of the most relevant high computational cost of stochastic feature-based training, stochastic features containing essential information can be dimension reduction of input spaces is to be carried out, achieved if choosing the truncated set of extracted from being latent variable techniques widely used for this aim that TFR parameters that exhibit the higher time-variant val- finds a transformation reducing p-dimensional stochastic ues of variance-based relevance measure. In other words, feature arrangement, Ξ ∈ R p×T , into q-dimensional stochas- dimension reduction is carried out by adapting in time tic set, Z ∈ Rq×T , q ≤ p, in such a way that the data commonly used latent variable techniques (by example,
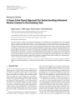
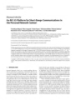
- 4 EURASIP Journal on Advances in Signal Processing Feature selection by Preprocessing TFR enhancement Feature generation Detection stochastic relevance Spectral centroids analysis Classification Artifact removal Validation Partitioning Centroids energy STFT Time/adapted PCA Cepstral coefficients Clustering Ξ = {x i ( t ) } y (t ) Sy (t , f ) g (Ξ, Z , t ) k -nn Figure 1: Schematic representation of an automated system for OSA diagnosing from t- f representation of PPG envelope. the one expressed by (6)), in such a way, that the data infor- [10]. Thus, ten children were diagnosed with OSA, whereas mation is maximally preserved, given a relevance function the remaining eleven were diagnosed as normal. as evaluation measure of time-variant transformation, and therefore, distinguishing relevant stochastic features. 3.2. Artifact Removal. It has been established that PPG measurements are quite sensitive to patient and/or probe- tissue movement artifact. Removal of such motion artifact 3. Experimental Setup as well as its separation from proper quality, although highly Based on relevance analysis of dynamic features that are variable, pulse recordings is a nontrivial signal processing extracted from t - f representation of PPG envelope, the exercise [11]. To cope with this drawback, the artifact Hjorth proposed methodology for diagnosing obstructive sleep detector is used. The principle behind the detector is that apnoea appraises next stages (see schematic representation when the PPG signal differs largely from an oscillatory of Figure 1): (a) preprocessing, (b) enhancement of TFR, (c) signal, it is very likely an artifact. Hjorth parameter has been dynamic feature extraction embracing dimension reduction proposed as an estimation of the central frequency of a signal of TFR-derived time series, and (d) OSA detection. and as half of the bandwidth. Further details of used artifact removal procedure are explained in [2]. 3.1. Clinic Photoplethysmography Database. This study uses the collection of polysomnography recordings of 21 children 3.3. Labeling of PPG Envelope Recordings. It is worth noting that were acquired over all-night-long sessions, as detailedly that the discussed automated system for OSA diagnosing is described in [3]. The children aging within 4.5 ± 2 years based on analysis of set of fragments that are partitioned were referred to the Miguel Servet Children’s Hospital in from the PPG envelope recordings. In particular, once the Zaragoza for suspected sleep-disordered breathing. Elec- OSA diagnostic labeling of PSG recording database had been troencephalographic electrode positions C3, C4, O1, and made by experts after clinical analysis of the considered O2, chin electromyogram, electrocardiographic leads I and children patient group, then, all recordings that in average II, eye movements, airflow as well as chest and abdominal can last as much as 8 hours are firstly partitioned into frag- respiratory efforts were recorded by a digital polygraph ments of two different considered lengths: 15 or 60 minutes. ( ÁÌÅ È ¼¼), according to the standard procedure Each fragment of either length is labeled using a decision of the American Thoracic Society [8]. PPG and arterial rule based on SaO2 signal which had been simultaneously oxygen saturation (SaO2 ) were measured continuously measured in time. Moreover, because of computational load using a pulse oximeter ( ÇËÅÇ Ì Ç¾»ËÔǾ ÅÓÒ ØÓÖ the fragments are partitioned again into segments lasting ÆÓÚ Ñ ØÖ Ü¸ Å Ð ËÝ×Ø Ñ×). Recordings were stored 90 seconds. Each 90-second frame is given the same label with a sample rate of 100 Hz, except electrocardiographic of the respective PPG fragment from where the segment biosignals that were sampled at 500 Hz. OSA evaluation has been extracted. So, labeling of partitioned PPG envelope from PSG data were scored by clinical experts using the recordings is provided according to the following procedures. standard procedures and criteria given in [9]. Children often desaturate with short apneas, as they have a lower functional residual capacity and a faster respiratory rate than (1) Fragment Labeling. In general, pathologic patients can adults. Therefore, obstructive apneas of any length are scored have some time periods related to both apneas and oxygen when interpreting pediatric sleep studies, as compared with desaturation, but, they can also exhibit some normal periods the 10-second duration in adults. Children may develop without any respiratory problems. So, regarding subject clinical sequelae with what appears to be relatively mild OSA. diagnosis, it is useful to consider PSG fragments as a whole Thus, an apnea index of 10 is considered to be severe by entity, then, a subject classification is carried out based on most pediatric pulmonologists, whereas it is considered only the number of PSG fragments that are related to apneic periods. The length of considered fragments is a tradeoff mildly abnormal in adults. One reason why a low apnea index can be associated with severe clinical disease is that the between fragments and subject classification. In this study, apnea index, the parameter used most often to characterize both 15-minute and 1-hour PSG fragments are considered, disordered breathing in adults, does not give an accurate as recommended in [3]. This assessed set of PSG fragments picture of the nature of the breathing disturbance in children is labeled as follows.
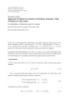
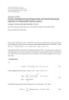
- EURASIP Journal on Advances in Signal Processing 5 8 Table 1: Amount of 90-second partitions accomplished for both cases of labeled ppg signal length. 7 Number of recordings 6 # Segments (∗ ) # Segments (∗∗ ) Clinical OSA diagnosis 5 Labeled PPG signal of 60-minute length 4 Normal 2618 1908 3 Pathologic 416 293 2 Assembled set 3034 2201 1 Labeled PPG signal of 15-minute length 0 Normal 2046 672 75 80 85 90 95 100 105 110 115 120 Pathologic 409 332 Heart beat rate per minute Assembled set 2455 1005 Figure 2: Histogram of heart beat rate per minute for a given set of labeled PPG fragments. So, the remaining group of segments adequately labeled At the beginning, a baseline level β, is fixed for each becomes herein the training set. patient that is related to the oxygen saturation, which corre- Table 1 summarizes the amount of 90-second segments sponds to the SaO2 signal mode of the entire night recording. Then, the total time intervals with SaO2 signal below β − accomplished for both cases of considered PPG signal length: firstly, after artifact removal (∗ ), then after clustering (∗∗ ), 3%, tβ−3 are calculated for each PSG fragment. Polysomno- which becomes the considered training set. graphic fragments of either length, 15-minute or 1-hour, are labeled according to the following criteria: 4. Results tβ−3 < 0.9 minutes, control, 4.1. TFR Enhancement and Feature Generation. Figure 3 0.9 minutes < tβ−3 < 3 minutes, doubt, (9) illustrates examples of estimated enhanced TFRs that are performed for cases of normal and pathological partitions, tβ−3 > 3 minutes, pathologic. respectively. Assessed TFRs are the matrices of dimension T × The above imposed criteria imply a minimum of 5% of the F , where F is the number of spectral components of the PPG time with evident oxygen desaturation to be considered as signal, f = [0, 1] Hz, and T is the number of discrete-time pathologic. The assumed threshold corresponds to a severe samples of each recording. This arrangement is intended OSA criteria in children of 18 apneas/hour having a mean du- to cover the full-time range as well as a broad range of ration of 10 seconds. In case of control group, that threshold frequencies. As seen, the normal case holds the low frequency is fixed to be 5 apneas/hour. As a result, the following data set (0.04–0.15 Hz) and high frequency (0.15–0.5 Hz) bands of of labeled fragments per considered class is assessed: control the signal. Conversely, the pathological representation does (70), doubt (24), and pathologic (11), when just considering not have this high frequency component, but its energy 1-hour PSG fragments, whereas the set of control (326), is concentrated around the lower frequencies. Neverthe- less, to illustrate the difficultness of addressed problem, doubt (47) and pathologic (47) is achieved for 15-minute PSG fragments; each one also labeled according to (9). Figure 3 shows several PPG segments belonging to normal (see Figures 3(a) and 3(c)), and pathological classes (see (2) Segment Labeling. Since each taken into account is Figures 3(b) and 3(d)) along with their respective estimated fragment of either length (one hour or 15 minutes) turns TFR, and it can be seen that there are some normal segments to be very long to provide computational stability when whose waveform resembles pathological ones, and vice versa. implementing discussed time-adapted PCA approach, then, A quantitative measure of the information contained in the PPG signals should be partitioned into processing time TFR maps is the entropy of each band [13], with frequencies windows of shorter duration (termed segments). Seeing that between 0.04 and 0.15 Hz in the low band, and frequencies each signal partition should comprise enough heart beats between 0.15 and 0.5 Hz in the high band. Table 2 shows the (see Figure 2), and taking into account that artifacts rarely results of the average entropy for each class as well as the aver- last more than 60 seconds, then the segment length is fixed age entropy for all the TFR maps, no matter what its class is. empirically to be 90 seconds. Further, every 90-second seg- Since the selection of the appropriate t - f representation ment is given the same label as the respective PPG fragment, is required, tuning of the respective parameters is achieved by wherein the partition is included. Nonetheless, there is a need a procedure developed for biosignals that is discussed in [14]. for further clustering procedure to ensure that the assessed Based on above explained spectral PPG envelope properties, set of PPG segments are properly labeled. After carried on bi- the STFT-based quadratic spectrogram is computed by class clustering (one cluster per class, control or apneic), by sliding Hamming windows for the following set of estimation using algorithm discussed in [12], distanced far enough from TFR parameters: 37.5 ms processing window length, 50% of both cluster centroids are removed from present analysis. overlapping, and 512 frequency bins.
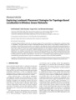
- 6 EURASIP Journal on Advances in Signal Processing High band entropy (0.15-0.5 Hz) = 237.76 High band entropy (0.15-0.5 Hz) = 184.93 Low band entropy (0.04-0.15 Hz) = 354.46 Low band entropy (0.04-0.15 Hz) = 559.63 100 100 Frequency (Hz)(log) 20 Frequency (Hz)(log) 20 15 15 10 10 5 5 0 10 20 30 40 50 60 70 80 90 0 10 20 30 40 50 60 70 80 90 Time (s) Time (s) (a) Normal (b) Apnoea High band entropy (0.15-0.5 Hz) = 101.27 High band entropy (0.15-0.5 Hz) = 214.95 Low band entropy (0.04-0.15 Hz) = 770.44 Low band entropy (0.04-0.15 Hz) = 428.16 100 100 25 Frequency (Hz)(log) 20 Frequency (Hz)(log) 20 15 15 10 10 5 5 0 10 20 30 40 50 60 70 80 90 0 10 20 30 40 50 60 70 80 90 Time (s) Time (s) (c) Normal (d) Apnoea Figure 3: Estimated TFR for examples of segments of 90-second length of the PPG envelope signals having labels: normal or apnoea, respectively. Table 2: Average entropy. 4.2. Estimation of Relevance Weights of Dynamic Features. Another aspect worthy of explicit attention is the generation Class Frequency band Entropy average of TFR-based dynamic features to be under study. Specifically Normal High band 316.22 for the present work, procedures for computation of cepstral coefficients and centroids are similar, where in both cases Normal Low band 651.06 Pathological High band 291.70 each TFR is split into a fixed number of bands [14]. So, in respect to calculation of coefficients, given in (3) and (4), the Pathological Low band 672.88 following working parameters are to be determined, namely, Normal and Pathological High band 312.86 the initial number of time-variant features, the number Normal and Pathological Low band 654.05 of bank filters, the impulse response, and its overlap over frequency domain. Nonetheless, it should be remarked that the initial number of dynamic features to be fixed is not a As stated above, each time-dependent feature is assumed critical issue for the proposed training methodology since to have a relative associated weight of relevance; the largest this amount is to be refined next by the relevance analysis. the estimated weight in (8) the most relevant the respective Therefore, in accordance to the accuracy reached for a dynamic feature. However, any estimate of relevance weight basic k-nn classifier, as shown in Figure 4, the input data is conditioned by the given dynamic feature set taken into space includes the following 39 TFR-based dynamic features account during calculation. Furthermore, for the concrete to be further studied: the first 22 spectral centroids and their case of OSA diagnosing, selection of the best set of features respective energy (estimated by using Hamming filters with can be achieved using, at least, two different combining 30% overlap, linear response distribution, and fixing γ = 1), approaches of comparison. Firstly, when taking a partially and the first 17 time series of vector cepstral coefficients divided set that comprises just a single type of performed that are computed by 48 triangular response filters with 50% dynamic features, that is, having the same principle of overlap. generation (see (3), (4) and (5)). Secondly, when the best
- EURASIP Journal on Advances in Signal Processing 7 x : 11 x : 17 y : 11 y : 11 z : 0.7973 z : 0.8712 0.8 0.8 20 20 Accuracy Accuracy 0.6 0.6 ents ents 15 0.4 0.4 pon pon 0.2 0.2 com com 10 10 0 0 5 of of 0 0 ber ber 10 10 0 0 Num Num 20 20 Number of coefficients Number of centroids (b) Cepstral coefficients (a) Spectral centroids Figure 4: On adjusting the number of TFR-based dynamic features. 1 1 0.9 0.8 0.8 Normalized weights Normalized weights 0.7 0.6 0.6 0.5 0.4 0.4 0.3 0.2 0.2 0.1 0 0 0 5 10 15 20 25 30 35 40 0 5 10 15 20 25 30 35 40 Index of ordered weights Index of features Energy of centroids Energy of centroids Centroids Centroids LFCC LFCC (a) Full set-based estimation (b) Estimates for partially divided set Figure 5: On computing relevance weights for considered combining approaches of comparison among dynamic features. contours are chosen among the whole set of features no schemes of considered parameterizations is the classification accuracy for the automatic OSA detection, which is estimated matter on their physical meaning. In this work, both com- using a simple k-nearest neighbor classifier, or k-nn classifier. bining approaches of dynamic features are studied in terms Several reasons account for the widespread use of this of dimension reduction, but also of accuracy performance. classifier: it is straightforward to implement, it generally leads It must be quoted that the former approach of selection is to a good recognition performance thanks to the nonlinearity more commonly used because of the convenient physical of its decision boundaries, and its complexity is assumed to interpretation of selected set of features. be independent of the number of classes. In this concrete Nonetheless, and just for the sake of illustration, this case, discussed methodology of training assesses the tuning work carries out tuning of proposed training approach based of the used k-nn classifier by calculating its optimal number on the latter combining way since the amount of considered of neighbors in terms of accuracy performance, as shown in dynamic features is significantly the higher. Specifically, the Figure 6. normalized relevance weights, which are estimated according With the aim of validating the discussed training to discussed methodology of relevance analysis for stochastic methodology for OSA detection, it is desired to obtain a processes, are depicted in Figure 5, being ordered by ordinal diagnostic over the full set of fragments to either considered feature numbers, which are calculated when taking the length. In turn, each fragment is diagnosed to be related of whole set of dynamic features (see Figure 5(a)), and partially either class grounded on decisions that are attained for the divided set (see Figure 5(b)), respectively. set of segments comprising the fragment in hand. Namely, at the beginning, there is a need to fix a minimum number 4.3. Performed Classification Accuracy. Throughout the fol- of segments classified as pathologic for giving the same lowing training procedures, the metric to adjust the different label to each fragment. That pathologic segment number,
- 8 EURASIP Journal on Advances in Signal Processing Table 3: Classification of PPG fragments for partially divided set. Classification for 60-m-length Classification for 15-m-length Dynamic feature set Se (%) S p (%) Acc (%) Se (%) S p (%) Acc (%) Energy of Centroids 81.82 94.29 92.59 95.74 54.60 59.79 Centroids 90.91 100 98.77 91.49 95.40 94.91 LFCC 100 85.71 87.65 93.62 95.40 95.40 Full set 100 100 100 97.98 93.56 93.35 1 0.9 0.85 x : 17 y : 0.8538 0.8 0.84 Correct rate 0.7 0.83 0.6 Se 0.5 0.82 0.4 0.81 0.3 0.8 0.2 0 5 10 15 20 25 30 0.1 0.2 0.3 0.4 0.5 0.6 0.7 0.8 Number of PCA components 1 − Sp 1-nn 9-nn 60-m-length 3-nn 11-nn 15-m-length 5-nn 13-nn 7-nn Figure 7: Performed ROC curves on dependence on both consid- Figure 6: Tuning of k-nn classifier by calculating the optimal ered fragment lengths. number of neighbors in terms of accuracy performance. Table 4: Classification of patient for training based on partially termed decision threshold, is fixed on dependence on both divided set of dynamic features. considered fragment lengths. It should be remarked that in this work, and because Dynamic feature set Se (%) S p (%) Acc (%) of reduced input data assemble, some recordings are used Energy of Centroids 70.00 87.50 73.68 for both training and validation, as well. Therefore, for testing the classifier the apparent accuracy is assessed that Centroids 80.00 87.50 83.33 is performed by using k-nn classifier (k = 3), as shown in LFCC 90.00 75.00 83.33 Table 3. Full set 80.00 87.50 83.33 The decision threshold is proposed to be adjusted based on performed ROC curve for patient classification, as shown in Figure 7. So, the location where the ROC curve gets the better classification accuracy points out to the decision considered for OSA diagnosing with the advantage that threshold. the each performed time-evolving parameter is related to a Lastly, each patient is diagnosed based on those decisions fixed spectral subband, and thus, leading to easer clinical made from the set of fragments measured for him. So a interpretation. It must be quoted that displayed outcomes rule to determine when a patient with a given number of of accuracy in Table 4 are performed just when considering pathological fragments is considered as a pathologic subject training over 60-m-length fragments. In case of 15-m-length, is needed. To do this, the percentage of time under pathologic and if taking into consideration the full set of dynamic features, the overall performance is the following: Se = fragments was considered and this threshold was selected for 90%, S p = 62.5%, and Acc = 77.78%, which is significatively maximizing Se and Sp, ratio at the ROC curve. Table 4 summarizes the performed patient classification lower that those assessed outcomes for training over 60-m- accuracy for both considered combining approaches of length fragments. dynamic features (partial and full set). In accordance with Next, the energy subset shows high relevance, but a the discussed approach of relevance analysis, the LFCC low performance; this may be explained because of notable and Centroids subsets of dynamic features reach the better redundance among the features. Therefore, the set of energies accuracy that is similar to the one achieved for the whole that is described by (5) should be rejected as perspective training set. As a result, both sets should be strongly dynamic features for OSA diagnosing.
- EURASIP Journal on Advances in Signal Processing 9 5. Discussion selected set of features. Furthermore, it has been established that the set of LFCC dynamic features It should be remarked that the main goal of present paper should be strongly considered for OSA diagnosing. is to use a complex of signal processing algorithms for Performed outcomes bring enough evidence that if the improvement in OSA diagnosis from PPG recordings, using a subset of LFCC features a fragment classifica- tion accuracy can reach as much as 93% value, which as an alternative for sleep apnea screening with the added provides an adequate scheme for ambulatory OSA benefit of low cost and simplicity. The methodology lies diagnosis. Therefore, to take into account evolution on the hypothesis that each time-dependent characteristic of random biological variables along time, defini- holds a relative associated weight of relevance, and in this tively, leads to an accuracy improvement of OSA connection, the results also evidence the following aspects to detection. Nonetheless, more efforts might be done to take into consideration. define feature set carrying fundamental information (i) The enhanced parameter estimation carried out by for the OSA classification, as quoted in [16]. Though, introducing t - f representations should be regarded performed outcomes look very promising in terms as a remarkable factor for an adequate generation of of accuracy of features extraction, testing of the any set of dynamic features. Here, feature enhance- discussed methodology should be provided using ment is performed by means of nonparametric larger data sets. spectrogram-based TFR that had been reported to (iv) The set of considered pathological subjects shows a be appropriate for the analysis of nonstationary larger low frequency entropy than the set of normals biological signals consisting of different frequency as expected from the bigger envelope oscillations components. Nonetheless, for the discussed method- driven by apnea. The reverse happens when analyzing ology for OSA detection, needed TFR enhancement entropy in the high frequency band where pathologic for dynamic feature extraction can be performed subjects reduce the entropy as compared to normals. by using more elaborated approaches: wavelet-based scalograms, projection pursuit, by using time fre- (v) The discussed automated system for OSA diagnosing quency distributions, and so forth, as discussed in is based on analysis of set of fragments that are [14]. Yet, no matter which particular TFR estimation partitioned from the PPG envelope recordings. In method is used, the final result is a large data matrix this regard, labeling of partitioned PPG envelope containing the time-frequency pattern, which has to recordings is provided so to have time epochs iden- be transformed into a feature vector for classification tified as apneic or not apneic. However, in clinical purposes holding the most relevant information in a practice usually the interest lies in having a subject compact fashion. diagnosis related to apnea, both in adults [17] and children [4], and not just a time screening of the (ii) With regard to feature extraction and selection, apnea events. With this aim, a rule has been applied proposed methodology for relevance analysis of to the fragment labeling, providing subject specific dynamic relevance is based on time-adapted linear diagnosis. Comparison with PSG clinical decision is component approach. At this point, two main issues provided, showing the potential of the methods here are to be considered: the measure associated to a presented. As a result, PPG can be considered as a given relevance function, and the multivariate trans- promising alternative to reduce the number of the formation through the time axis, which is assumed PSG sleep recordings. to maximize the measure of relevance present in the contours by their projection onto a new space. As a measure of relevance, the maximum variance 6. Conclusions is assumed. Specifically, time-adapted PCA version is discussed throughout this paper as unsupervised A new methodology for OSA detection is explored, which method to perform relevance analysis of consid- is based on relevance analysis of dynamic features extracted ered set of stochastic features. Though proposed from nonparametric t - f representation of the recordings methodology of relevance analysis can extended to of PPG envelope. Particularly, a time-evolving version of other techniques linear component decomposition, the standard PCA is discussed that performs stochastic as shown in [15]. dimensionality reduction of the dynamic features in hand. (iii) Two different combining approaches for selecting the Discussed methodology of relevance analysis benefits of the dynamic properties of the time-evolving spectral parame- best set of contours are studied. Firstly, when taking ters, during either transient physiological or pathological a partially divided set that relates dynamic features episodes. As a result, PPG can be considered as a promising having the same principle of generation. Secondly, alternative to reduce the number of the PSG sleep recordings. when the best features are chosen despite of their In addition, two different combining approaches for physical meaning. From performed accuracy showed in Table 3 one can conclude that even that the former selecting the best set of contours are studied: firstly, when case reaches comparable figures of accuracy, the taking dynamic features having the same principle of latter approach of selection is more commonly used generation. Secondly, when the best features are chosen because of the convenient physical interpretation of despite of their physical meaning. In this case, the latter
- 10 EURASIP Journal on Advances in Signal Processing approach turns to be more suitable because of the con- distributions,” Journal of the Franklin Institute, vol. 337, no. 4, pp. 453–467, 2000. venient physical interpretation of selected set of features [6] S. Cerutti, “In the spotlight: biomedical signal processing: and provided accuracy of selection is more commonly used a well established discipline or a paradigm to promising because of the convenient physical interpretation of selected integrated visions?” IEEE Reviews in Biomedical Engineering, set of features. Furthermore, it has been established that the vol. 2, pp. 9–11, 2009. LFCC and Centroids subsets of dynamic features should be [7] Y. Zhao and S. Zhang, “Generalized dimension-reduction strongly considered for OSA diagnosing since it increases framework for recent-biased time series analysis,” IEEE Trans- the specificity in the apnoea detector. Both subsets display actions on Knowledge and Data Engineering, vol. 18, no. 2, a patient classification accuracy of 83.33%, while in [4] an pp. 231–244, 2006. accuracy of 80% is reported; consequently, the advantage of [8] G. M. Loughlin, R. T. Brouillette, L. J. Brooke et al., the method proposed in this paper to increase the specificity “Standards and indications for cardiopulmonary sleep studies of the obstructive sleep apnea detector is evident. in children,” American Journal of Respiratory and Critical Care Medicine, vol. 153, no. 2, pp. 866–878, 1996. The TFR-based parameter estimation is a remarkable fac- [9] C. L. Marcus, R. D. Annett, L. J. Brooks et al., “Cardiorespira- tor for an adequate dynamic feature generation. Therefore, tory sleep studies in children: establishment of normative data for OSA detection, it would be of benefit to explore needed and polysomnographic predictors of morbidity,” American enhancement by using more elaborated approaches (wavelet- Journal of Respiratory and Critical Care Medicine, vol. 160, based scalograms, matching pursuit, etc.). Besides, as feature no. 4, pp. 1381–1387, 1999. work, further efforts on finding an alternative for OSA diag- [10] C. L. Marcus, “Sleep-disordered breathing in children,” Amer- nosing, having the added benefit of low cost and simplicity, ican Journal of Respiratory and Critical Care Medicine, vol. 164, should be focused on extended studies to corroborate the no. 1, pp. 16–30, 2001. potential of another approaches in conjunction with heart [11] J. Allen, “Photoplethysmography and its application in clin- rate variation analysis [18, 19]. ical physiological measurement,” Physiological Measurement, vol. 28, no. 3, pp. R1–R39, 2007. [12] T. Kanungo, D. M. Mount, N. S. Netanyahu, C. D. Piatko, Acknowledgments R. Silverman, and A. Y. Wu, “An efficient k-means clustering algorithms: analysis and implementation,” IEEE Transactions This work is supported by the Ministerio de Ciencia y on Pattern Analysis and Machine Intelligence, vol. 24, no. 7, Tecnolog´a, FEDER, under project TEC2010-21703-C03-02, ı pp. 881–892, 2002. by CIBER de Bioingenier´a, Biomateriales y Nanomedicina ı [13] R. G. Baraniuk, P. Flandrin, A. J. E. M. Janssen, and O. J. J. Michel, “Measuring time-frequency information content through Instituto de Salud Carlos III, by ARAID and Ibercaja using the R´ nyi entropies,” IEEE Transactions on Information e under project “Programa de APOYO A LA I+D+i” by Grupo Theory, vol. 47, no. 4, pp. 1391–1409, 2001. Consolidado GTC from DGA (Spain), and by “Centro de [14] A. F. Quiceno-Manrique, J. I. Godino-Llorente, M. Blanco- Investigaci´ n e Innovaci´ n de Excelencia—ARTICA”, financed o o Velasco, and G. Castellanos-Dominguez, “Selection of dynam- by COLCIENCIAS (Colombia) y Becas para Estudiantes ic features based on time-frequency representations for heart Sobresalientes de Posgrado de la Universidad Nacional de murmur detection from phonocardiographic signals,” Annals Colombia. of Biomedical Engineering, vol. 38, no. 1, pp. 118–137, 2010. [15] L. D. Avenda˜ o-Valencia, J. I. Godino-Llorente, M. Blanco- n Velasco, and G. Castellanos-Dominguez, “Feature extraction References from parametric time-frequency representations for heart murmur detection,” Annals of Biomedical Engineering, vol. 38, [1] W. W. Flemons, D. Buysse, S. Redline et al., “Sleep-related no. 8, pp. 2716–2732, 2010. breathing disorders in adults: recommendations for syndrome M. O. Mendez, J. Corthout, S. van Huffel et al., “Automatic [16] definition and measurement techniques in clinical research,” screening of obstructive sleep apnea from the ECG based Sleep, vol. 22, no. 5, pp. 667–689, 1999. on empirical mode decomposition and wavelet analysis,” [2] E. Gil, J. Mar´a Vergara, and P. Laguna, “Detection of decreases ı Physiological Measurement, vol. 31, no. 3, pp. 273–289, 2010. in the amplitude fluctuation of pulse photoplethysmography [17] A. H. Khandoker, M. Palaniswami, and C. K. Karmakar, signal as indication of obstructive sleep apnea syndrome in “Support vector machines for automated recognition of children,” Biomedical Signal Processing and Control, vol. 3, obstructive sleep apnea syndrome from ECG recordings,” no. 3, pp. 267–277, 2008. IEEE Transactions on Information Technology in Biomedicine, [3] E. Gil, M. Mendez, J. M. Vergara, S. Cerutti, A. M. Bianchi, and vol. 13, no. 1, pp. 37–48, 2009. P. Laguna, “Discrimination of sleep-apnea-related decreases in [18] M. J. Lado, X. A. Vila, L. Rodr´guez-Li˜ ares, A. J. M´ ndez, ı n e the amplitude fluctuations of ppg signal in children by HRV D. N. Olivieri, and P. F´ lix, “Detecting sleep apnea by heart e analysis,” IEEE Transactions on Biomedical Engineering, vol. 56, rate variability analysis: assessing the validity of databases and no. 4, pp. 1005–1014, 2009. algorithms,” Journal of Medical Systems. In press. ´ [4] E. Gil, R. Bailon, J. M. Vergara, and P. Laguna, “PTT ´ [19] L. M. Sepulveda-Cano, C. M. Travieso-Gonz´ lez, J. I. Godino- a variability for discrimination of sleep apnea related decreases Llorente, and G. Castellanos-Dom´nguez, “On improvement ı in the amplitude fluctuations of PPG signal in children,” of detection of Obstructive Sleep Apnea by partial least square- IEEE Transactions on Biomedical Engineering, vol. 57, no. 5, based extraction of dynamic features,” in Proceedings of the pp. 1079–1088, 2010. 32nd Annual International Conference of the IEEE Engineering in Medicine and Biology Society (EMBC ’10), pp. 6321–6324, [5] M. Sun, M. L. Scheuer, and R. J. Sclabassi, “Decomposition of Buenos Aires, Argentina, August-September 2010. biomedical signals for enhancement of their time-frequency
CÓ THỂ BẠN MUỐN DOWNLOAD

-

Báo cáo hóa học: " Research Article On the Throughput Capacity of Large Wireless Ad Hoc Networks Confined to a Region of Fixed Area"
 11 p |
  110
|
110
|  10
10
-

Báo cáo hóa học: "Research Article Are the Wavelet Transforms the Best Filter Banks for Image Compression?"
7 p | 120
| 7
-

Báo cáo hóa học: "Research Article Detecting and Georegistering Moving Ground Targets in Airborne QuickSAR via Keystoning and Multiple-Phase Center Interferometry"
11 p | 116
| 7
-

Báo cáo hóa học: "Research Article Cued Speech Gesture Recognition: A First Prototype Based on Early Reduction"
19 p | 116
| 6
-

Báo cáo hóa học: " Research Article Practical Quantize-and-Forward Schemes for the Frequency Division Relay Channel"
11 p | 114
| 6
-
Báo cáo hóa học: " Research Article Breaking the BOWS Watermarking System: Key Guessing and Sensitivity Attacks"
8 p | 104
| 6
-
Báo cáo hóa học: " Research Article A Fuzzy Color-Based Approach for Understanding Animated Movies Content in the Indexing Task"
17 p | 108
| 6
-

Báo cáo hóa học: " Research Article Some Geometric Properties of Sequence Spaces Involving Lacunary Sequence"
8 p | 94
| 5
-
Báo cáo hóa học: " Research Article Eigenvalue Problems for Systems of Nonlinear Boundary Value Problems on Time Scales"
10 p | 90
| 5
-
Báo cáo hóa học: "Research Article Exploring Landmark Placement Strategies for Topology-Based Localization in Wireless Sensor Networks"
12 p | 118
| 5
-

Báo cáo hóa học: " Research Article A Motion-Adaptive Deinterlacer via Hybrid Motion Detection and Edge-Pattern Recognition"
10 p | 93
| 5
-

Báo cáo hóa học: "Research Article Color-Based Image Retrieval Using Perceptually Modified Hausdorff Distance"
10 p | 97
| 5
-

Báo cáo hóa học: "Research Article Probabilistic Global Motion Estimation Based on Laplacian Two-Bit Plane Matching for Fast Digital Image Stabilization"
10 p | 112
| 4
-

Báo cáo hóa học: " Research Article Hilbert’s Type Linear Operator and Some Extensions of Hilbert’s Inequality"
10 p | 77
| 4
-

Báo cáo hóa học: "Research Article Quantification and Standardized Description of Color Vision Deficiency Caused by"
9 p | 120
| 4
-
Báo cáo hóa học: " Research Article An MC-SS Platform for Short-Range Communications in the Personal Network Context"
12 p | 70
| 4
-
Báo cáo hóa học: "Research Article On the Generalized Favard-Kantorovich and Favard-Durrmeyer Operators in Exponential Function Spaces"
12 p | 102
| 4
-

Báo cáo hóa học: " Research Article Approximation Methods for Common Fixed Points of Mean Nonexpansive Mapping in Banach Spaces"
7 p | 74
| 3


Chịu trách nhiệm nội dung:
Nguyễn Công Hà - Giám đốc Công ty TNHH TÀI LIỆU TRỰC TUYẾN VI NA
LIÊN HỆ
Địa chỉ: P402, 54A Nơ Trang Long, Phường 14, Q.Bình Thạnh, TP.HCM
Hotline: 093 303 0098
Email: support@tailieu.vn
Giấy phép Mạng Xã Hội số: 670/GP-BTTTT cấp ngày 30/11/2015 Copyright © 2022-2032 TaiLieu.VN. All rights reserved.

