


Báo cáo hóa học: " The origin of the red emission in n-ZnO nanotubes/p-GaN white light emitting diodes"
lượt xem 9
download
 Download
Vui lòng tải xuống để xem tài liệu đầy đủ
Download
Vui lòng tải xuống để xem tài liệu đầy đủ
Tuyển tập báo cáo các nghiên cứu khoa học quốc tế ngành hóa học dành cho các bạn yêu hóa học tham khảo đề tài: The origin of the red emission in n-ZnO nanotubes/p-GaN white light emitting diodes
Bình luận(0) Đăng nhập để gửi bình luận!
Nội dung Text: Báo cáo hóa học: " The origin of the red emission in n-ZnO nanotubes/p-GaN white light emitting diodes"
- Alvi et al. Nanoscale Research Letters 2011, 6:130 http://www.nanoscalereslett.com/content/6/1/130 NANO EXPRESS Open Access The origin of the red emission in n-ZnO nanotubes/p-GaN white light emitting diodes N H Alvi*, Kamran ul Hasan, Omer Nur, Magnus Willander Abstract In this article, the electroluminescence (EL) spectra of zinc oxide (ZnO) nanotubes/p-GaN light emitting diodes (LEDs) annealed in different ambients (argon, air, oxygen, and nitrogen) have been investigated. The ZnO nanotubes by aqueous chemical growth (ACG) technique on p-GaN substrates were obtained. The as-grown ZnO nanotubes were annealed in different ambients at 600°C for 30 min. The EL investigations showed that air, oxygen, and nitrogen annealing ambients have strongly affected the deep level emission bands in ZnO. It was concluded from the EL investigation that more than one deep level defect is involved in the red emission appearing between 620 and 750 nm and that the red emission in ZnO can be attributed to oxygen interstitials (Oi) appearing in the range from 620 nm (1.99 eV) to 690 nm (1.79 eV), and to oxygen vacancies (Vo) appearing in the range from 690 nm (1.79 eV) to 750 nm (1.65 eV). The annealing ambients, especially the nitrogen ambient, were also found to greatly influence the color-rendering properties and increase the CRI of the as - grown LEDs from 87 to 96. Introduction vacancies (V o ) and zinc interstitial (Zn i ) [9-14]. Other Zinc oxide (ZnO) is a direct wide band gap (3.37 eV) authors have reported that the green emission can be semiconductor. In recent years, it has attracted the attributed to both oxygen and zinc vacancies [15,16]. The attention of the research community for a variety of violet-blue and blue emissions were attributed to zinc practical applications due to its excellent properties interstitial (Zni) and Zinc vacancies (Vzn), respectively, in combined with the facility of growing it in the nanos- the DLE [17-19]. The yellow emission in hydrothermally tructure form. grown nanorods was attributed to the presence of OH At present, ZnO is considered to be a very attractive groups on the surface [9]. The formation energy and material because it combines semiconducting and piezo- energy levels of different defects within the DLE have electric properties and in addition it is transparent, bio- been experimentally studied and calculated by other compatible, and bio-safe. These unique properties of authors [9,20]. However, the origins of different defect ZnO makes it as a promising candidate for the next emissions are still not fully understood, and the hypoth- generation of visible and ultra-violet (UV) light-emitting eses that have been proposed to explain the different diodes (LEDs) and lasing devices. The visible emission defect emissions (violet, blue, green, yellow, orange-red, results because ZnO possesses deep level emission and red) have been controversial [9,10,21,22]. Therefore, (DLE) bands and emit all the colors in the visible region still a considerable interest is being shown in investigat- with good color-rendering properties [1-8]. It is impor- ing the defect emissions in ZnO in general and, ZnO tant to understand the origin of the emissions related to nanostructures in particular, because of their great deep level defects in ZnO for the development of optoe- potential for optical applications. lectronic devices with high efficiency. The ZnO nanotubes are the best candidates for white A number of studies on the optical properties of ZnO LEDs among all of the known oxide semiconductors, nanostructures have suggested that, within the DLE, and they can be easily grown via chemical and other the green (approximately 500 nm) and red (approxi- physical vapor-phase approaches as well [6]. The small mately 600 nm) emissions have originated from oxygen footprint and the large surface area-to-volume ratio make the ZnO nanotubes a better candidate for hetero- * Correspondence: nhalvi@gmail.com junction white LEDs as compared to thin films. The lat- Department of Science and Technology (ITN) Campus Norrköping, Linköping tice mismatch can be compensated in view of the University, 60174 Norrköping, Sweden © 2011 Alvi et al; licensee Springer. This is an Open Access article distributed under the terms of the Creative Commons Attribution License (http://creativecommons.org/licenses/by/2.0), which permits unrestricted use, distribution, and reproduction in any medium, provided the original work is properly cited.
- Alvi et al. Nanoscale Research Letters 2011, 6:130 Page 2 of 7 http://www.nanoscalereslett.com/content/6/1/130 preparation technique developed by Greene et al. [31]. favorable stress/strain values observed for ZnO nano- The grown ZnO nanorods on the p-GaN substrates tubes as compared to thin films. A notable advantage of were etched by placing the samples in 5-7.5 molar KCl nanotube-based LEDs is that each nanotube can act as a (Potassium chloride) solution for 5-10 h at 95°C. wave guide, minimizing the side scattering of light, thus The samples were then annealed in argon, air, oxygen, enhancing light emission and extraction efficiency [23]. and nitrogen ambients at 600°C for 30 min. Pt/Ni/Au The GaN has close lattice mismatch with ZnO, and the alloy was used to form ohmic contact with the p-GaN close lattice match is the main factor that can influence substrate. The thicknesses of the Pt, Ni, and the Au the optical and electrical properties of heterojunctions. layers were 20, 30, and 80 nm, respectively. The samples Only a few studies focusing on n-ZnO nanotubes, on p- were then annealed at 350°C for 1 min in flowing argon GaN, and on white light emitting diodes (LEDs) are atmosphere. This alloy gives a minimum specific contact available in the literature [24-26]. resistance of 5.1 × 10 -4 Ω cm -2 [32]. An insulating Many researchers have investigated the DLEs in ZnO. The optical properties of chemically synthesized ZnO photo-resist layer was then spun coated on the ZnO nanorods, post-growth annealed in temperatures ranging NTs to fill the gaps between the nanotubes with a view from 200 to 800°C, have been studied using photolumines- to isolate electrical contacts on the ZnO NTs to prevent cence measurements. In our investigation, the as-grown them from reaching the p-type substrate, thereby help- nanotubes were annealed at 600°C as this temperature was ing to prevent the carrier cross talk among the nano- found to be very effective in modifying the DLEs tubes. To form the top contacts, the tip of the ZnO [9,10,21,27,28]. Previously, the authors have investigated NTs were exposed using plasma ion-etching technique the effect of post-growth annealing treatment on the elec- after the deposition of the insulating photo-resist layer. troluminescence (EL) of n-ZnO nanorods/p-GaN LEDs. Non-alloyed Pt/Al metal system was used to form the The annealing ambients have the same effect on EL of ohmic contacts to the ZnO NTs. The thicknesses of the LEDs, but ZnO nanotube-based LEDs were found to have Pt and the Al layers were 50 and 60 nm, respectively. approximately twice the EL intensity as compared to that This contact gives a minimum specific contact resis- tance of 1.2 × 10⁻⁵ Ω cm-2 [28]. The diameter of the top of ZnO nanorod-based LEDs [29]. ZnO nanostructures grown by low temperature (
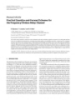
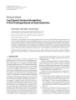
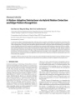
- Alvi et al. Nanoscale Research Letters 2011, 6:130 Page 3 of 7 http://www.nanoscalereslett.com/content/6/1/130 (a) (b) 1.2 (c) (d) 1.0 Current (mA) 0.8 0.6 0.4 0.2 0.0 -8 -6 -4 -2 0 2 4 6 8 10 Voltage (V) Figure 1 SEM image of ZnO nanotubes on p-GaN substrate. (a) before annealing, (b) after annealing, (c) typical I-V characteristics for the fabricated LEDs, and (d) The schematic illustration of the fabricated LEDs. The EL intensities of the violet (400 nm) and violet-blue r espectively. The broad green, orange, orange-red, (452 nm) of all the annealed samples are decreased as and red peaks are centered approximately at 536 nm compared with the as-grown samples. In the literature, (2.31 eV), 597 nm (2.07 eV), 618 nm (2.00 eV), and 705 it was reported that the violet emission from undoped nm (1.75 eV), respectively. The EL emission in the ultra- ZnO nanorods is related to Zinc interstitial (Zni) [22]. violet (UV) region was not detected here since the authors were interested only in the visible emissions; The violet peak is centered at 3.1 eV (400 nm), and this therefore, the lower EL detector limit was set to 400 nm. agrees well with the transition energy from Zni level to The EL intensity of the samples annealed in argon is the valence band in ZnO (approximately 3.1 eV). The low compared to the as-grown and all other samples violet-blue peak was centered at 2.74 eV (452 nm) for annealed in different ambients. The ZnO nanotubes all the EL measurements in different ambients. It is having low growth temperature (
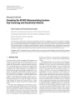
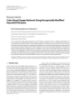
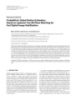
- Alvi et al. Nanoscale Research Letters 2011, 6:130 Page 4 of 7 http://www.nanoscalereslett.com/content/6/1/130 618 nm as grown annealed in argon 597 nm 705 nm 50000 annealed in air 536 nm annealed in oxygen 45000 annealed in nitrogen 40000 EL intensity (a.u.) 35000 452 nm 30000 25000 20000 15000 400 nm 10000 5000 0 300 400 500 600 700 800 900 Wavelength (nm) Figure 2 Electroluminescence spectra of the LEDs at an injection current of 3 mA for the as grown and annealed ZnO NTs in different ambients under forward bias of 25 V and it shows the shift in emission peak after annealing in different ambient. air and oxygen, respectively. These emissions are attrib- visible region, and the annealing affects the deep level uted to oxygen interstitials Oi, and believed to be due to defects that are responsible for low energy emissions from the green-to-red region in the visible spectra (see band transition from zinc interstitial (Zn i ) to oxygen in Figure 2). It increases the transition recombination interstitial (Oi) defect levels in ZnO [22]. The position rate for the deep level defects that are responsible for of the Oi level is located approximately at 2.28 eV below the green-to-red emissions. Therefore, the EL intensities the conduction band, and it is expected that the band of the DLEs (the green to red) are increased, while transition from Zni to Oi level is approximately 2.06 eV those of the violet and violet-blue emissions are [22]. This agrees well with the orange-red peaks that are decreased after annealing in different ambients. Only for centered approximately at 2.00 and 2.07 eV. the case of the argon ambient, all the defects are modi- The EL spectra of ZnO nanotubes annealed in oxygen fied, and owing to this, the El intensities of all the emis- and air ambients are nearly similar. The EL intensity of sions decreased after annealing. the sample annealed in oxygen is higher compared to The broad green peak, centered at 536 nm (2.31 eV) that of the sample annealed in air. Its means that air in the EL spectra of the as-grown ZnO nanotube-based and oxygen produce the same defects, but the ratio of LEDs and LEDs based on annealed ZnO nanotubes in these defects is more in the case of oxygen. As the argon ambient, is attributed to oxygen vacancy (Vo). It orange-red emission is attributed to oxygen interstitials Oi [22], the annealing in oxygen ambient increases the is believed that this phenomenon is due to band transi- tion from zinc interstitial (Zni) to oxygen vacancy (Vo) amount of oxygen-related O i defects; therefore, the defect levels in ZnO [22]. This has been explained by orange-red emission dominates the EL spectra. the full potential linear muffin-tin orbital method, which The red emission centered at 705 nm (1.75 eV) can be posits that the position of the V o level is located attributed to oxygen vacancies (Vo). For the ZnO nano- approximately at 2.47 eV below the conduction band, tubes annealed in nitrogen ambient, the following oxy- and the position of the Zni level is theoretically located gen desorption may occur; at 0.22 eV below the conduction band. Therefore, it is ZnO Vo Zn Zn 1 / 2O 2 expected that the band transition from Zni to Vo level is approximately 2.25 eV [22]. This agrees well with the The zinc vacancies are filled with zinc during the green peak that is centered approximately at 2.31 eV. annealing of the ZnO nanotubes in the nitrogen ambi- The orange-red peaks are centered at 597 nm (2.07 ent. The majority of defects are oxygen vacancies (Vo) eV) and 618 nm (2.00 eV) for the samples annealed in
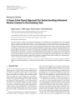
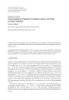
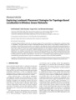
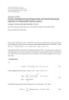
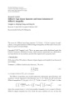
- Alvi et al. Nanoscale Research Letters 2011, 6:130 Page 5 of 7 http://www.nanoscalereslett.com/content/6/1/130 (from 690 to 750 nm) has increased significantly as that are created by the evaporation of oxygen [21]. The compared with the as-grown ZnO nanotubes. Therefore, red emission centering at 706 nm (1.75 eV) may be it is clear that the red emissions from 620 to 690 nm attributed to the transition from oxygen vacancy (Vo) and from 690 to 750 nm have different origins. The red level to top of the valance band in ZnO. Using full- emission in the range of 620 nm (1.99 eV) to 690 nm potential linear muffin-tin orbital method, the calculated (1.79 eV) can be attributed to Oi, and that in the range energy level of the Vo in ZnO is 1.62 eV below the con- duction band [20]. Hence, the energy interval from the of 690 nm (1.79 eV) to 750 nm (1.65 eV) can be attribu- V o energy level to the top of the valence band is ted to Vo. approximately 1.75 eV. It agrees well with that observed Figure 3a,b,c,d,e shows the CIE 1931 color space chro- maticity diagram in the (x, y) coordinates system. The for the red emission centered at 1.75 eV. By comparing the EL spectra of samples annealed in chromaticity coordinates are (0.3559, 0.3970), (0.3557, oxygen and nitrogen, it can be concluded that the total 3934), (0.4300, 0.4348), (0.4800, 0.4486), and (0.4602, red emission ranging from 620 nm (1.99 eV) to 750 nm 0.3963) with correlated color temperatures (CCTs) of (1.65 eV) is the combination of emissions related to Oi 4802, 4795, 3353, 2713, and 2583 K for the as-grown ZnO nanotubes, annealed in argon, air, oxygen, and and Vo defects. The EL spectra of the samples annealed nitrogen, in the forward bias, respectively. The chroma- in oxygen show that after annealing, the red emission is ticity coordinates are very close to the Planckian locus enhanced in the range from 620 nm (1.99 eV) to 690 which is the trace of the chromaticity coordinates of a nm (1.79 eV) when compared to the as-grown samples, blackbody. The colors around the Planckian locus can and the EL spectra of the samples annealed in nitrogen be regarded as white. It is clear that the fabricated LEDs ambient show that, after annealing, the red emission is are in fact the white LEDs. enhanced in the range from 690 nm (1.79 eV) to 750 Figure 4 shows the schematic band diagram of the nm (1.65 eV). The EL intensities of the green, yellow, DLE emissions in ZnO, based on the full-potential linear orange, and the red emission (from 620 to 690 nm) are muffin-tin orbital method and the reported data. decreased, but the EL intensity of the red emission Figure 3 The CIE 1931 x, y chromaticity space of ZnO nanotubes, for (a) as grown, (b) annealed in argon, (c) annealed in air, (d) annealed in oxygen, (e) annealed in nitrogen, and (f) all together.
- Alvi et al. Nanoscale Research Letters 2011, 6:130 Page 6 of 7 http://www.nanoscalereslett.com/content/6/1/130 Figure 4 Schematic band diagram of the DLE emissions in ZnO based on the full potential linear muffin-tin orbital method and the reported data as described in references [9-20,22]. Also oxygen vacancies situated 1.65 eV below the conduction band are denoted to be contributing to the red emission. In summary, the origin of red emission in chemically References 1. Gong Y, Andelman T, Neumark G, O’Brien S, Kuskovsky I: Origin of defect- obtained ZnO nanotubes has been investigated by EL related green emission from ZnO nanoparticles: effect of surface spectra. The as-grown samples were annealed in different modification. Nanoscale Res Lett 2007, 2:297-302. ambient (argon, air, oxygen, and nitrogen). It was observed 2. Bian J, Liu W, Liang H, Hu L, Sun J, Luo Y, Du G: Room temperature electroluminescence from the n-ZnMgO/ZnO/p-ZnMgO heterojunction that the post-growth annealing in nitrogen and oxygen device grown by ultrasonic spray pyrolysis. Chem Phys Lett 2006, 430:183-187. ambients strongly affected the green, yellow, orange, and 3. Alivov YI, Look DC, Ataev BM, Chukichev MV, Mamedov VV, Zinenko VI, red emissions of ZnO nanotubes. The EL intensities of the Agafonov YA, Pustovit AN: Fabrication of ZnO-based metal-insulator- semiconductor diodes by ion implantation. Solid-State Electron 2004, green, the yellow, the orange, and the red emissions were 48:2343-2346. gradually increased after annealing in air, oxygen ambi- 4. Look DC: Recent advances in ZnO materials and devices. Mater Sci Eng B ents, and decrease in argon ambient. However, in nitrogen 2001, 80:383-387. 5. Yang LL, Zhao QX, Willander M, Yang JH, Ivanov I: Annealing effects on ambient, the EL emission of the red peak in the range of optical properties of low temperature grown ZnO nanorod arrays. J Appl 690–750 nm was increased, and in the range of 620-690 Phys 2009, 105:053503-053507. nm, it was decreased as compared with the as-grown sam- 6. Willander M, Nur O, Zhao QX, Yang LL, Lorenz M, Cao BQ, Zúñiga Pérez J, Czekalla C, Zimmermann G, Grundmann M, Bakin A, Behrends A, Al- ples. It was found that more than one deep level defect are Suleiman M, El-Shaer A, Che Mofor A, Postels B, Waag A, Boukos N, involved in producing the red emission in ZnO. Travlos A, Kwack HS, Guinard J, Le Si Dang D: Zinc oxide nanorod based photonic devices: recent progress in growth, light emitting diodes and lasers. Nanotechnology 2009, 20:332001. 7. Wang ZL: Nanostructures of zinc oxide. Mater Today 2004, 7:26-33. Abbreviations 8. Klingshirn C: ZnO: From basics towards applications. Phys Status Solidi (b) ACG: aqueous chemical growth; DLE: deep level emission; EL: 2007, 244:3027-3073. electroluminescence; LEDs: light emitting diodes; UV: ultra-violet; ZnO: zinc 9. Djurisic AB, Leung YH, Tam KH, Hsu YF, Ding L, Ge WK, Zhong YC, oxide. Wong KS, Chan WK, Tam HL, Cheah KW, Kwok WM, Phillips D: Defect emissions in ZnO nanostructures. Nanotechnology 2007, 18:095702. Acknowledgements 10. Tam KH, Cheung CK, Leung YH, DjuriÅ¡ić AB, Ling CC, Beling CD, Fung S, The financial support from the Advanced Functional Materials (AFM) project Kwok WM, Chan WK, Phillips DL, Ding L, Ge WK: Defects in ZnO nanorods at Linköping University is highly appreciated prepared by a hydrothermal method. J Phys Chem B 2006, 110:20865-20871. Authors’ contributions 11. Jeong SH, Kim BS, Lee BT: Photoluminescence dependence of ZnO films grown on Si(100) by radio-frequency magnetron sputtering on the All authors contributed equally and read and approved the final manuscript. growth ambient. Appl Phys Lett 2003, 82:2625-2627. 12. Shan FK, Liu GX, Lee WJ, Shin BC: The role of oxygen vacancies in Competing interests epitaxial-deposited ZnO thin films. J Appl Phys 2007, 101:053106-053108. The authors declare that they have no competing interests. 13. Djurisic AB, Leung YH, Tam KH, Ding L, Ge WK, Chen HY, Gwo S: Green, yellow, and orange defect emission from ZnO nanostructures: Influence Received: 22 October 2010 Accepted: 10 February 2011 of excitation wavelength. Appl Phys Lett 2006, 88:103107-103103. Published: 10 February 2011
- Alvi et al. Nanoscale Research Letters 2011, 6:130 Page 7 of 7 http://www.nanoscalereslett.com/content/6/1/130 14. Carcia PF, McLean RS, Reilly MH, Nunes JG: Transparent ZnO thin-film transistor fabricated by rf magnetron sputtering. Appl Phys Lett 2003, 82:1117-1119. 15. Zhao QX, Klason P, Willander M, Zhong HM, Lu W, Yang JH: Deep-level emissions influenced by O and Zn implantations in ZnO. Appl Phys Lett 2005, 87:211912-211913. 16. Yamauchi S, Goto Y, Hariu T: Photoluminescence studies of undoped and nitrogen-doped ZnO layers grown by plasma-assisted epitaxy. J Cryst Growth 2004, 260:1-6. 17. Cao B, Cai W, Zeng H: Temperature-dependent shifts of three emission bands for ZnO nanoneedle arrays. Appl Phys Lett 2006, 88:161101-161103. 18. Zeng H, Li Z, Cai W, Liu P: Strong localization effect in temperature dependence of violet-blue emission from ZnO nanoshells. J Appl Phys 2007, 102:104307-104304. 19. Wei XQ, Man BY, Liu M, Xue CS, Zhuang HZ, Yang C: Blue luminescent centers and microstructural evaluation by XPS and Raman in ZnO thin films annealed in vacuum, N2 and O2. Physica B 2007, 388:145-152. 20. Lin B, Fu Z, Jia Y: Green luminescent center in undoped zinc oxide films deposited on silicon substrates. Appl Phys Lett 2001, 79:943-945. 21. Quang LH, Chua SJ, Ping Loh K, Fitzgerald E: The effect of post-annealing treatment on photoluminescence of ZnO nanorods prepared by hydrothermal synthesis. J Cryst Growth 2006, 287:157-161. 22. Ahn CH, Kim YY, Kim DC, Mohanta SK, Cho HK: A comparative analysis of deep level emission in ZnO layers deposited by various methods. J Appl Phys 2009, 105:089902-089901. 23. Lai E, Kim W, Yang P: Vertical nanowire array-based light emitting diodes. Nano Res 2008, 1:123-128. 24. Yuen C, Yu SF, Lau SP, Rusli , Chen TP: Fabrication of n-ZnO:Al/p-SiC(4H) heterojunction light-emitting diodes by filtered cathodic vacuum arc technique. Appl Phys Lett 2005, 86:241111-241113. 25. Young Joon H, Jong-Myeong J, Miyoung K, Seong-Ran J, Kyung Ho P, Gyu- Chul Y: Structural and optical characteristics of GaN/ZnO coaxial nanotube heterostructure arrays for light-emitting device applications. New Journal of Physics 2009, 11:125021. 26. Sadaf J, Israr M, Kishwar S, Nur O, Willander M: White electroluminescence using ZnO nanotubes/GaN heterostructure light-emitting diode. Nanoscale Res Lett 2010, 5:957-960. 27. Leung YH, Djurisic AB, Liu ZT, Li D, Xie MH, Chan WK: Defect photoluminescence of ZnO nanorods synthesized by chemical methods. J Phys Chem Solids 2008, 69:353-357. 28. Kim HK, Kim KK, Park SJ, Seong TY, Adesida I: Formation of low resistance nonalloyed Al/Pt ohmic contacts on n-type ZnO epitaxial layer. J Appl Phys 2003, 94:4225-4227. 29. Vayssieres L, Keis K, Lindquist SE, Hagfeldt A: Purpose-built anisotropic metal oxide material: 3D highly oriented microrod array of ZnO. J Phys Chem B 2001, 105:3350-3352. 30. Alvi NH, Willander M, Nur O: The effect of the post-growth annealing on the electroluminescence properties of n-ZnO nanorods/p-GaN light emitting diodes. Superlattices and Microstructures 2010, 47:754-761. 31. Greene LE, Law M, Tan DH, Montano M, Goldberger J, Somorjai G, Yang P: General route to vertical ZnO nanowire arrays using textured ZnO seeds. Nano Lett 2005, 5:1231-1236. 32. Jang JS, Chang IS, Kim HK, Seong TY, Lee S, Park SJ: Low-resistance Pt/Ni/ Au ohmic contacts to p-type GaN. Appl Phys Lett 1999, 74:70-72. doi:10.1186/1556-276X-6-130 Cite this article as: Alvi et al.: The origin of the red emission in n-ZnO nanotubes/p-GaN white light emitting diodes. Nanoscale Research Letters 2011 6:130. Submit your manuscript to a journal and benefit from: 7 Convenient online submission 7 Rigorous peer review 7 Immediate publication on acceptance 7 Open access: articles freely available online 7 High visibility within the field 7 Retaining the copyright to your article Submit your next manuscript at 7 springeropen.com
CÓ THỂ BẠN MUỐN DOWNLOAD

-

Báo cáo hóa học: "Research Article Detecting and Georegistering Moving Ground Targets in Airborne QuickSAR via Keystoning and Multiple-Phase Center Interferometry"
 11 p |
  116
|
116
|  7
7
-
Báo cáo hóa học: "Research Article Are the Wavelet Transforms the Best Filter Banks for Image Compression?"
7 p | 120
| 7
-
Báo cáo hóa học: " Research Article Practical Quantize-and-Forward Schemes for the Frequency Division Relay Channel"
11 p | 114
| 6
-
Báo cáo hóa học: " Research Article Breaking the BOWS Watermarking System: Key Guessing and Sensitivity Attacks"
8 p | 104
| 6
-
Báo cáo hóa học: " Research Article A Fuzzy Color-Based Approach for Understanding Animated Movies Content in the Indexing Task"
17 p | 108
| 6
-
Báo cáo hóa học: "Research Article Cued Speech Gesture Recognition: A First Prototype Based on Early Reduction"
19 p | 116
| 6
-

báo cáo hóa học:" Recombinant bromelain production in Escherichia coli: Process optimization in shake flask culture by Response Surface Methodology"
34 p | 96
| 6
-
Báo cáo hóa học: "Research Article Color-Based Image Retrieval Using Perceptually Modified Hausdorff Distance"
10 p | 97
| 5
-

Báo cáo hóa học: " Yeast expressed recombinant Hemagglutinin protein of Novel H1N1 elicits neutralising antibodies in rabbits and mice"
29 p | 76
| 5
-
Báo cáo hóa học: " Research Article Some Geometric Properties of Sequence Spaces Involving Lacunary Sequence"
8 p | 94
| 5
-
Báo cáo hóa học: "Research Article Exploring Landmark Placement Strategies for Topology-Based Localization in Wireless Sensor Networks"
12 p | 118
| 5
-
Báo cáo hóa học: " Research Article A Motion-Adaptive Deinterlacer via Hybrid Motion Detection and Edge-Pattern Recognition"
10 p | 93
| 5
-
Báo cáo hóa học: "Research Article Probabilistic Global Motion Estimation Based on Laplacian Two-Bit Plane Matching for Fast Digital Image Stabilization"
10 p | 112
| 4
-

báo cáo hóa học:" Sparse correlation matching-based spectrum sensing for open spectrum communications"
43 p | 74
| 4
-
Báo cáo hóa học: "Research Article On the Generalized Favard-Kantorovich and Favard-Durrmeyer Operators in Exponential Function Spaces"
12 p | 102
| 4
-
Báo cáo hóa học: " Research Article Hilbert’s Type Linear Operator and Some Extensions of Hilbert’s Inequality"
10 p | 77
| 4
-
Báo cáo hóa học: "Research Article Quantification and Standardized Description of Color Vision Deficiency Caused by"
9 p | 120
| 4
-
Báo cáo hóa học: " Cytopathic Mechanisms of HIV-1"
22 p | 78
| 4


Chịu trách nhiệm nội dung:
Nguyễn Công Hà - Giám đốc Công ty TNHH TÀI LIỆU TRỰC TUYẾN VI NA
LIÊN HỆ
Địa chỉ: P402, 54A Nơ Trang Long, Phường 14, Q.Bình Thạnh, TP.HCM
Hotline: 093 303 0098
Email: support@tailieu.vn
Giấy phép Mạng Xã Hội số: 670/GP-BTTTT cấp ngày 30/11/2015 Copyright © 2022-2032 TaiLieu.VN. All rights reserved.

