


báo cáo khoa học: "Anticancer activity of the iron facilitator LS081"
lượt xem 3
download
 Download
Vui lòng tải xuống để xem tài liệu đầy đủ
Download
Vui lòng tải xuống để xem tài liệu đầy đủ
Tuyển tập báo cáo các nghiên cứu khoa học quốc tế ngành y học dành cho các bạn tham khảo đề tài: Anticancer activity of the iron facilitator LS081
Bình luận(0) Đăng nhập để gửi bình luận!
Nội dung Text: báo cáo khoa học: "Anticancer activity of the iron facilitator LS081"
- Li et al. Journal of Experimental & Clinical Cancer Research 2011, 30:34 http://www.jeccr.com/content/30/1/34 RESEARCH Open Access Anticancer activity of the iron facilitator LS081 Zhen Li*, Hiroki Tanaka, Floyd Galiano and Jonathan Glass Abstract Background: Cancer cells have increased levels of transferrin receptor and lower levels of ferritin, an iron deficient phenotype that has led to the use of iron chelators to further deplete cells of iron and limit cancer cell growth. As cancer cells also have increased reactive oxygen species (ROS) we hypothesized that a contrarian approach of enhancing iron entry would allow for further increased generation of ROS causing oxidative damage and cell death. Methods: A small molecule library consisting of ~11,000 compounds was screened to identify compounds that stimulated iron-induced quenching of intracellular calcein fluorescence. We verified the iron facilitating properties of the lead compound, LS081, through 55Fe uptake and the expression of the iron storage protein, ferritin. LS081- induced iron facilitation was correlated with rates of cancer cell growth inhibition, ROS production, clonogenicity, and hypoxia induced factor (HIF) levels. Results: Compound LS081 increased 55Fe uptake in various cancer cell lines and Caco2 cells, a model system for studying intestinal iron uptake. LS081 also increased the uptake of Fe from transferrin (Tf). LS081 decreased proliferation of the PC-3 prostate cancer cell line in the presence of iron with a lesser effect on normal prostate 267B1 cells. In addition, LS081 markedly decreased HIF-1a and -2a levels in DU-145 prostate cancer cell line and the MDA-MB-231 breast cancer cell lines, stimulated ROS production, and decreased clonogenicity. Conclusions: We have developed a high through-put screening technique and identified small molecules that stimulate iron uptake both from ferriTf and non-Tf bound iron. These iron facilitator compounds displayed properties suggesting that they may serve as anti-cancer agents. Background catabolized senescent red blood cells. Hence, the uptake of iron for its final incorporation into hemoglobin or Iron is an essential element required for many biological other ferriproteins requires 3 different transport path- processes from electron transport to ATP production to ways: intestinal iron absorption, iron release from heme and DNA synthesis with the bulk of the iron macrophages, and iron uptake into erythroid precursors being in the hemoglobin of circulating red blood cells and other iron-requiring cells. [1,2]. Too little iron leads to a variety of pleiotropic In vertebrates, iron entry into the body occurs primar- effects from iron deficiency anemia to abnormal neuro- ily in the duodenum, where Fe3+ is reduced to the more logic development, while too much iron may result in soluble Fe2+ by a ferrireductase (DcytB), which trans- organ damage including hepatic cirrhosis and myocar- diopathies. The system for the maintenance of iron ports electrons from cytosolic NADPH to extracellular acceptors such as Fe 3+ [3]. The Fe 2+ is transported homeostasis is complex. Approximately 1 mg of the iron utilized daily for the synthesis of nascent red blood cells across the brush border membrane (BBM) of duodenal is newly absorbed in the intestine to replace the amount enterocytes via the transmembrane protein, DMT1 lost by shed epithelial cells and normal blood loss. The (divalent metal transporter, also known as SLC11a2, remainder of the iron incorporated into newly synthe- DCT1, or Nramp2) [4,5]. Subsequently, the internalized Fe 2+ is transported across the basolateral membrane sized hemoglobin is derived from macrophages from (BLM) by the transmembrane permease ferroportin (FPN1, also known as SLC40a1) [3,6] in cooperation * Correspondence: zli@lsuhsc.edu with the multicopper oxidase Hephaestin (Heph) [7,8]. Feist-Weiller Cancer Center, Department of Medicine, LSU Health Sciences Center, Shreveport, Louisiana. 1501 Kings Highway, Shreveport, LA 71130, The exit of iron from macrophages onto plasma USA © 2011 Li et al; licensee BioMed Central Ltd. This is an Open Access article distributed under the terms of the Creative Commons Attribution License (http://creativecommons.org/licenses/by/2.0), which permits unrestricted use, distribution, and reproduction in any medium, provided the original work is properly cited.
- Li et al. Journal of Experimental & Clinical Cancer Research 2011, 30:34 Page 2 of 10 http://www.jeccr.com/content/30/1/34 Wessling-Resnick and colleagues have used a cell- t ransferrin (Tf) is also mediated by the interaction of based fluorescence assay to identify chemicals in a small FPN1 and Heph [9]. The efflux of iron into the systemic molecule chemical library that block iron uptake circulation from the enterocyte and the macrophage is [23-25]. While some of the chemicals identified inhib- negatively regulated by hepcidin, the iron-stores regula- ited Tf-mediated iron uptake [23] more recent studies tor. Hepcidin binds to FPN1 promoting phosphoryla- utilizing a HEK293T cell line that stably expresses tion, internalization, and subsequent catabolism of FPN1 DMT1 have identified chemicals that act specifically on via proteasomes [10]. the iron transporter [24,25]. In the current study, we In erythroid precursor cells, and indeed in all non- have used a similar assay to identify chemicals that intestinal cells, iron uptake is mediated by receptor increase iron uptake into cells and demonstrate that mediated endocytosis of ferri-transferrin (Fe-Tf) these chemicals are effective in increasing iron transport although routes for non-transferrin bound Fe (NTBI) across Caco2 cells, a model system for studying intest- also exist. Fe-Tf binds to the transferrin receptor (TfR) inal iron absorption, and increasing iron uptake into on the cell surface [11] and the Fe-Tf complex is inter- various cancer cell lines, favourably altering several nalized into endosomes with subsequent acidification of the endosome which releases Fe3+ from Tf. The Fe3+ is aspects of the malignant phenotype. then reduced to Fe2+ by the ferrireductase STEAP 3 [12] Methods and the Fe2+ transported by DMT1 into the cytosol. Cell lines and Chemicals There are two situations in which one could envision All antibodies were purchased from Santa Cruz Biotech- a benefit from being able to accelerate or otherwise nology, Inc. (Santa Cruz, CA) except for rabbit anti- increase cellular uptake of iron. First, iron deficiency is HIF-1 a and -2 a which were purchased from Novos endemic in much of the world resulting in decreased Biologicals (Littleton, CO). All analytical chemicals were ability to work especially in women of child bearing age from Sigma-Aldrich (St. Louis, MO). The chemical and in impaired neurologic development in children libraries were obtained from ChemDiv (San Diego, CA) [13,14]. Common factors leading to an imbalance in and TimTec (Newark, DE). CM-H2DCFDA (5-(and-6)- iron metabolism include insufficient iron intake and chloromethyl-2’,7’-dichlorodihydrofluorescein diacetate, decreased absorption due to poor dietary sources of iron acetyl ester) or DCFDA and calcein-AM were from [15]. In fact, Fe deficiency is the most common nutri- Invitrogen (Carlsbad, CA). The cell lines K562, PC-3, tional deficiency in children and the incidence of iron Caco2, MDA-MB231, and 267B1 were obtained from deficiency among adolescents is also rising [16]. Iron ATCC (Bethesda, MD). RPMI1640 and DMEM culture deficiency ultimately leads to anemia, a major public media and fetal calf serum (FCS) were obtained from health concern affecting up to a billion people world- Atlanta Biologicals (Lawrenceville, GA). wide, with iron deficiency anemia being associated with poorer survival in older adults [17]. As much of iron Screening for chemicals that increase iron uptake deficiency is nutritional, drugs that promote iron uptake K562 cells were loaded with calcein by incubating cells could be beneficial without the necessity of changing with 0.1 μM of Calcein-AM for 10 min in 0.15 M NaCl-20 economic and cultural habits that dictate the use of iron mM Hepes buffer, pH 7.4, with 0.1% BSA at 37°C followed poor diets. by extensive washing with NaCl-Hepes buffer to remove A second, and separate, situation exists in malignan- extracellular bound calcein, and aliquoted at 5 × 10⁴ - 1 × cies. Cancer cells often have an iron deficient phenotype 105 cells/well in 96-well plates containing test compounds with increased expression of TfR, DMT1, and/or Dcytb at 10 μM and incubated for 30 min in a humidified 37°C and decreased expression of the iron export proteins incubator with 5% CO2 before baseline fluorescence was FPN1 and Heph [18-20]. Since higher levels of ROS are obtained at 485/520 nm (excitation/emission) with 0.1% observed in cancer cells compared to non-cancer cells DMSO as the vehicle control and DTPA as a strong iron drugs that stimulate iron uptake into cancer cells might chelator control to block all iron uptake. The fluorescence further increase ROS levels via the Fenton reaction. The was then obtained 30 min after addition of 10 μM ferrous increased ROS might lead to oxidative damage of DNA, ammonium sulfate in 500 μM ascorbic acid (AA). The proteins, and lipids [21,22] and cell death or potentiate percentage of fluorescence quench was calculated relative cell killing by radiation or radiomimetic chemotherapeu- to 200 μM DTPA added as a blocking control and DMSO tic agents. Further, increased intracellular levels of Fe as a vehicle control as follows: would increase the activity of prolyl hydroxylases poten- tiating hydroxylation of HIF-1a and HIF-2a, transcrip- F = (F0 - Ff )/F0 (1) tion factors that drive cancer growth, resulting in where Δ F is the change in fluorescence, or fluores- decreased HIF expression via ubiquination and protea- some digestion. cence quench, observed in any well, F 0 represents the
- Li et al. Journal of Experimental & Clinical Cancer Research 2011, 30:34 Page 3 of 10 http://www.jeccr.com/content/30/1/34 fluorescence after 30 min of compound, and Ff repre- 16 hours. The cells were then lysed with RIPA buffer sents the fluorescence 30 min after addition of Fe. (50 mM Tris-HCl, 1% NP-40, 0.25% Na-deoxycholate, These results were normalized to the blocking and vehi- 150 mM NaCl, 1 mM EDTA, pH 7.4) and the lysates cle controls as follows: separated on SDS-PAGE with subsequent transfer to nitrocellulose for western blot analysis using the follow- Fn = (Fcompound - Fmin )/(Fmax - Fmin ) (2) ing antibodies: mouse anti-human ferritin-heavy chain, mouse anti-human TfR, anti-HIF-1a or -2a, and rabbit where Δ F n is the normalized quench observed after anti-human b-actin. Results were quantitated by densi- addition of iron, Fcompound is the Δ F observed with com- tometry and relative densitometric units expressed as pound, Fmin is the average Δ F of the DMSO control; and the ratio of protein of interest to actin. Fmax is the average Δ F of the DTPA control. With this normalization 100% indicates that a test compound is as 55 Fe uptake and transport in Caco2 cells potent as DTPA in blocking iron-induced quenching and Caco2 cells were seeded in 6.5 mm bicameral chambers 0% indicates no inhibition of iron quenching by a test in 24-well plates, grown in 10% FCS-minimum essential compound or the same quench as observed with the medium for ~2 week to reach a transepithelial electrical DMSO vehicle control. Compounds with Δ Fn between resistance (TEER) of 250 .cm2. The cells were incubated 0% and 100% are defined as inhibitors of iron uptake. in serum-free DMEM with 0.1% BSA overnight and the Negative values for Δ Fn represent compounds that facili- inserts then transferred to fresh 24-well plates with the tate iron uptake into cells. Our criteria for active com- basal chambers containing 700 μL of 20 μM Apo-Tf in pounds to be further investigated was arbitrarily set as Δ DMEM. Test compound at concentrations of 0-100 μM Fn = 50-100% quenching for iron uptake inhibitors and < in a total volume of 150 μl were added to the top cham- -50% quenching for iron uptake facilitators. ber, incubated for 60 min at 37°C, 5% CO2 incubator, followed by the addition of 55Fe to the top chamber at a 55 Fe uptake into K562 cells final concentration of 0.125 μM 55Fe in 1 mM AA. At 3 × 10⁵ K562 cells in 300 μl NaCl-Hepes-0.1% BSA were various times up to 2 hours, the top and bottom cham- incubated for 30 min with test compound at various ber buffer were removed, the cell layer washed exten- concentrations as indicated in a humidified 37°C incuba- tor with 5% CO2. A mixture of 55Fe- and AA was then sively with Hepes-NaCl containing 0.1 mM EDTA, and 55 added for a final concentration of 1 μM 55Fe -1 mM AA Fe radioactivity determined in the upper and lower chamber buffers and the cell layer. and the cells incubated for an additional 60 min. The reaction was stopped by the addition of ice-cold quench ROS measurement buffer (NaCl-Hepes with 2 mM EDTA) followed by To determine if compound affected cellular production extensive washing of the cells which were then dispersed of ROS, 5 × 10 5 K562 cells were washed, treated for in scintillation fluid and 55Fe radioactivity determined in 30 min with compound in Hepes-NaCl buffer, and a Tri-carb 2900 TR liquid scintillation analyzer (Packard intracellular levels of ROS detected with CM-H2DCFDA BioScience Company, Meriden, CT). by flow cytometry as described [26]. ROS levels are pre- sented as mean fluorescence intensity in the appropriate Preparation of medium containing 10% FCS with iron- gated areas. K562 cells exposed to 10 μM H 2 O2 were saturated Tf used as positive control for ROS generation. Iron on the Tf in FCS was removed from the Tf by low- ering the pH to 4.5 followed by dialysis against 0.1 M Cell proliferation and colony formation assays citrate buffer, pH 4.5, in the presence of Chelex for 16 To assess cell proliferation PC-3 cells were seeded into hours, and dialyzed again against HEPES buffered saline, 96-well plates at 1 × 10⁴/well for 24 hr to allow for cell pH 7.4, in the presence of Chelex. FeNTA (1:2 molar attachment. Cells were treated with 0.1% DMSO, 10 μM ratio for Fe: NTA) was then added to the now iron-free ferric ammonium citrate, 10 μM LS081, or the combina- FCS at 1 mM final concentration followed by extensive tion of 10 μ M Fe + 10 μ M LS081 in RPMI1640-10% dialysis against HEPES buffered saline, pH 7.4. The FCS for 24-72 hr with the treatment media being resulted FCS containing iron-saturated Tf was added replenished every 24 hr. Cell proliferation was accessed into RPMI1640 to make the medium containing 10% 24, 48, or 72 hr after treatment. In separate experiments, iron-saturated FCS. PC-3 or 267B1 cells were plated in 96-well plates at 1 × 10⁴ /well in RPMI1640 containing 10% FCS overnight Western blot analysis of ferritin, TfR, and HIF-1a and -2a before 24 hr treatment with 0.1% DMSO, 2 μM ferric PC-3 cells were plated into 6-well plates at cell density ammonium citrate, 3 or 10 μM LS081 ± Fe in serum- of 5 × 10 5 cells/well for overnight attachment before free-RPMI1640, with an additional 24 hr incubation in addition of test compound or vehicle control for
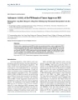
- Li et al. Journal of Experimental & Clinical Cancer Research 2011, 30:34 Page 4 of 10 http://www.jeccr.com/content/30/1/34 RPMI-1640-10% FCS without LS081. Cell proliferation was assayed with CellTiter 96 AQueous Non-Radioactive Cell Proliferation Assay (Promega) kit on a Synergy 2 Spectrophotometric Analyzer (BioTek Inc., Winooski, Vermont) with wavelength of 490 nM and the results standardized to the percentage of inhibition induced by DMSO alone. Cell viability was assessed by Trypan blue exclusion. Colony formation was assayed in PC-3 cells by plating 500 cells/well in 6-well plates in 10% FCS-RPMI1640 for 48 hr, followed by incubation with 0.1% DMSO, 10 μM ferric ammonium citrate, 3 or 10 μ M LS081 ± ferric ammonium citrate for an additional 48 hours, after which the media was replaced with 10% FCS-RPMI1640. Figure 1 Dose response curve of LS081 on 55Fe uptake in K562 The cells were cultured for an additional 10-14 days and cells. 55Fe uptake was measured as described in the Methods. then stained with Crystal violet before colonies consist- Briefly, 3 × 10⁵ K562 cells were incubated with LS081 for 30 min at ing of more than 50 cells were enumerated. concentrations of 0.1-100 μM prior to the addition of 1 μM 55Fe-1 mM AA with subsequent determination of intracellular 55Fe radioactivity. Results were expressed as fold increase in 55Fe Results radioactivity relative to cells treated with 0.1% DMSO alone. Shown A cell based fluorescence assay to screen small molecules are the means ± SEM of 3 separate experiments with triplicates for that increase iron transport into cells each experiment. The insert shows the chemical structure of LS081. We utilized an intracellular calcein fluorescence screen- ing method modified from Brown et al. [23] to screen a library consisting of ~11000 small molecules for their affected; in addition, the chemicals did not affect the in vitro quenching of calcein by iron (data not shown). ability to increase or decrease iron uptake into cells. As noted in the Method, compounds which enhanced the Caco2 cells grown in bicameral chambers for 2-3 calcein fluorescence quenching induced by iron were weeks to reach the desired trans-epithelial electrical considered to be iron facilitators while those that resistance were used as a model for intestinal iron decreased fluorescence quenching were considered inhi- absorption. Under these conditions the Caco2 cells dif- bitors of iron uptake. In the initial screening of the com- ferentiate to form a confluent, polarized monolayer with pounds obtained from ChemDiv thirty compounds the brush border membrane of the apical surface in exhibited negative values for Δ Fn, i.e. Δ Fn < -50% and contact with the buffer of the top chamber which then were therefore defined as iron facilitators including a mimics the intestinal lumen and the basal layer in con- number of hydrazone compounds. A similar number of tact with the bottom chamber which represents the sys- compounds had Δ F n = 50-100% and were defined as temic circulation. This model allows assaying in the presence of LS081 the transport of 55Fe from the apical iron uptake inhibitors. About 10 of these inhibitors blocked the in vitro quenching of calcein by iron and chamber into the cells and then into the bottom cham- ber. In this model over 2 hours, LS081 increased 55Fe were therefore presumably iron chelators. An additional 80 structural analogs of the hydrazone class of facilitators uptake into the Caco2 cells and into the basal chamber obtained from TimTec were subsequently assessed with by 4.0 ± 0.66 and 3.71 ± 0.29 fold, respectively, com- 16 more facilitators identified. The ability to facilitate pared to the DMSO-treated control (mean fold change iron uptake was verified using a dose response curve ± SEM of 3 experiments) with P < 0.001 for both uptake from 0.1 - 100 μM of a putative facilitator with the same and transport into the basal chamber. calcein quenching assay as well as by measuring the effect of the presumed facilitators on 55 Fe uptake into K562 Effect of the iron facilitator LS081 on intracellular levels cells. Additionally, we arbitrarily chose as the lead com- of ferritin pound LS081, the first compound to be verified by a To determine if the increased intracellular iron entered dose-response curve (Figure 1). The ability to facilitate into a metabolically active pool of iron, cellular ferritin iron uptake was confirmed by dose response curves in 14 levels were measured in PC-3 cells at various times after of the 16 facilitators identified on the initial screen. The the addition of LS081. The effects of LS081 on ferritin EC50 for LS081 was 1.22 ± 0.48 μM with a range of EC50 expression were determined under two conditions: of 0.5-2 μ M for the remainder of the iron facilitators. RPMI1640-10% FCS to which 2 μM ferric ammonium Within the range of concentrations used over the length citrate was added or RPMI with 10% iron saturated FCS. As shown in Figure 2, LS081 at 3 and 10 μ M of the screening neither cell number nor cell viability was
- Li et al. Journal of Experimental & Clinical Cancer Research 2011, 30:34 Page 5 of 10 http://www.jeccr.com/content/30/1/34 Figure 2 The effect of LS081 on ferritin expression. PC-3 cells were treated for 16 hr with DMSO alone, or 3 or 10 μM LS081 in the presence of non-transferrin-bound-iron (ferric ammonium citrate, left panel) or transferrin-bound-iron (Fe-saturated-Tf, right panel). The cellular proteins were separated by SDS-PAGE, and ferritin heavy chain, and b-actin detected by Western blotting as described in the Methods. The top panel shows a representative autoradiography. The bottom panel shows the ratio of ferritin to the actin loading control by densitometric analysis (mean values ± SEM of 3-4 separate experiments). *: p < 0.05, **: p < 0.01 compared to DMSO alone by 1-way ANOVA with Tukey’s posttests. medium (Figure 4), 267B1 cells, an immortalized, stimulated ferritin synthesis from both ferric ammonium non-malignant prostate cell line, showed slight growth citrate and iron saturated Tf. In preliminary experiments inhibition with 3 or 10 μM LS081 alone with no poten- the level of ferritin protein was not significantly tiation of growth inhibition by the addition of 2 μM fer- increased by compound alone (data not shown). ric ammonium citrate. In contrast, when PC-3 cells were grown in serum-free medium, growth inhibition was far Iron facilitation is cytotoxic to cancer cells greater for the combination of 2 μM ferric ammonium We examined the effect of the iron facilitator LS081 on citrate with either 3 μM LS081 (36 ± 6% inhibition) or ROS generation using DCFDA whose fluorescence 10 μM LS081 (64 ± 8% inhibition) compared to LS081 intensity is increased in response to elevated intracellu- alone (14 ± 1% or 37 ± 8% inhibition for 3 or 10 μ M, lar ROS. As shown in Figure 3, K562 cells had signifi- respectively) (Figure 4, n = 3 experiments). 2 μM ferric cantly increased levels of ROS production when exposed ammonium citrate alone did not affect cell proliferation to LS081 in the presence of ferric ammonium citrate compared to vehicle control (data not shown). but not with iron or LS081 alone. The proliferation of PC-3 cells, a prostate cancer cell line, was not inhibited by 10 μ M ferric ammonium Effect of the iron facilitator LS081 on clonogenic potential citrate or 10 μ M LS081 when cultured in 10% FCS- on prostate cancer cells RPMI1640 for 24 or 48 hrs (Table 1) or 72 hr (data not To determine the effect of LS081 on the clonogenic shown). However, as also shown in Table 1, treatment potential of prostate cancer cells colony formation with 10 μM LS081 plus 10 μM ferric ammonium citrate assays were performed on PC-3 cells in the presence of for 24 hr or 48 hr significantly reduced the number of ferric ammonium citrate in RPMI1640 supplemented cells relative to controls. When grown in serum-free with 10% FCS (Figure 5). In combination with iron,
- Li et al. Journal of Experimental & Clinical Cancer Research 2011, 30:34 Page 6 of 10 http://www.jeccr.com/content/30/1/34 was too low to be detected by Western blot analysis, especially when cultured at normal oxygen concentra- tions, we used the prostate cancer cell line DU145 cul- tured in 1% oxygen as this cell line expressed levels of HIF-1a that could be detected by Western blot analysis. LS081 plus Fe significantly reduced the level of HIF-1a in DU 145 cells (Figure 6A). The effect of LS081 on the level of HIF-2a was also examined using breast cancer cell line MDA-MB-231, because the levels of HIF-2a were too low in prostate cancer cell lines to be detected by Western blot analysis. LS081 significantly reduced HIF-2 a expression in MDA-MB-231 cells cultured under normoxic conditions in medium containing 10% FCS (Figure 6B). Discussion Figure 3 The effect of LS081 on ROS generation. Approximately As noted by Wessling-Resnik and colleagues in their 5 × 10⁵ K562 cells were treated for 30 min with 0.1% DMSO alone, search for iron uptake inhibitors chemical genetics, i.e. the 10 μM ferric ammonium citrate alone, 3 or 10 μM LS081 alone, or use of small molecules to perturb a physiologic system, the combination of Fe and LS081 at the indicated concentrations. The cells were then incubated with DCFDA and fluorescence has the ability to shed light on mechanisms of the pathway measured by a BD Calibur Flow cytometer expressing the that is being disturbed [25]. Additionally, compounds that fluorescence as the mean total fluorescence intensity in the gated perturb iron uptake could have beneficial, medicinal area. Shown are the means ± SEM of 3 separate experiments with effects. For example, small molecules which stimulate iron 2-3 replicates for each experiment. *** denotes P < 0.001 compared to the DMSO, Fe, or LS081 alone by 1-way ANOVA with Tukey’s absorption might be used as adjuncts to diets that are posttests. iron-deficient. Conversely, molecules that blocked iron uptake might counter the increased iron absorption and resultant iron toxicity often seen in widely prevalent dis- L S081 at concentrations of 3 or 10 μ M significantly eases such as sickle cell disease and the thalassemias. Wes- reduced the number of colonies compared to that trea- sling-Resnik has screened chemical libraries to identify ted with iron alone or LS081 alone. Reduced colony for- chemicals that block iron uptake [23] but also found “acti- mation by the combination of Fe and LS081 were also vators ” of iron uptake which were postulated to have seen in another prostate cancer cell line, DU145, com- potential as agents to relieve iron deficiency. In the current pared to Fe alone (data not shown). study we have adapted their calcein-based cell assay and identified compounds that increase iron uptake into Effect of the iron facilitator LS081 on the level of HIF-1a Caco2 cells, as a model system for intestinal transport, and and -2a protein into various cancer cell lines, thereby altering several We investigated if the iron facilitating compound LS081 aspects of the malignant phenotype. would affect the level of the transcription factors HIF- In our assay, intracellular calcein fluorescence in K562 1a and -2a. Because the level of HIF-1a in PC-3 cells cells was quenched upon extracellular iron being trans- ported into the cells. Iron facilitation was defined as fluorescence quenching greater in the presence of a test Table 1 The effect of LS081 and iron on the proliferation compound compared to vehicle control. In addition, of PC-3 cells none of the facilitators appeared to be iron chelators as Treatment 24 hours 48 hours the chemicals did not compete with iron for calcein DMSO 1.00 ± 0.00* 1.00 ± 0.00* quenching in an in vitro assay and the iron facilitators 10 μM Fe 1.13 ± 0.04*** 1.02 ± 0.06* affected the cell cycle differently from the iron chelator 10 μM LS081 1.05 ± 0.05** 1.01 ± 0.03* deferoxamine (data not shown). We did, however, find a 10 μM Fe and LS081 0.81 ± 0.01 0.80 ± 0.09 number of chemicals that inhibited iron uptake and sev- PC-3 cells at a density of 1 × 10⁴ in RPMI1640-10% FCS were seeded into 96- eral of these chemicals appeared to be iron chelators by well plates for 24 hrs prior to the addition of 0.1% DMSO ± 10 μM ferric an in vitro assay. Notwithstanding that the faciltators ammonium citrate or 10 μM LS081 ± 10 μM ferric ammonium citrate. Cell proliferation was assayed at 24 or 48 hrs after treatments as described in the inhibited cell proliferation there was no evidence that Methods and the fold-change calculated compared to DMSO alone. Presented the chemicals caused cell lysis as cell number was not are the means of the fold change ± SEM of 3 independent experiments with each experiment performed in 3-4 replicates. * indicates P < 0.05, ** P < 0.01, diminished during the screening assays or during subse- *** P < 0.001 compared to Fe plus LS081 by 2-way ANOVA with Bonferroni’s quent measurements of 55Fe uptake. posttests.
- Li et al. Journal of Experimental & Clinical Cancer Research 2011, 30:34 Page 7 of 10 http://www.jeccr.com/content/30/1/34 Figure 4 Effect of LS081 on the proliferation of the prostate cancer cells and non-malignant prostate cells. Both prostate cancer cell line PC-3 and the immortalized, non-malignant prostate cell line 267B1 cells grown in serum-free RPMI1640 with 0.1% bovine serum albumin were treated with 0.1% DMSO or with 3 or 10 μM LS081 ± 2 μM ferric ammonium citrate for 24 hr followed by an additional 24 hr in RPMI1640-10% FCS before cell proliferation was assayed by MTS. The results are expressed as growth inhibition relative to the DMSO controls (means ± SEM of 3-4 independent observations with four replicates in each observation). *: P < 0.05, **: P < 0.01 comparing with or without Fe conditions by 2- way ANOVA with Bonferroni’s posttests. clue to the mode of action of the facilitators comes from I n iron uptake whether from NTBI, in the case of our observation that LS081 increased iron uptake when enterocytes, or from ferri-Tf, in the case of all other cell the sole source of iron was ferri-Tf. Iron uptake from Tf types, the uptake occurs by iron being transported requires that the Tf undergo receptor mediated endocy- through DMT1. The facilitators could act by activating tosis and DMT1 is part of the internalized endosome. DMT1, repositioning DMT1 within the cell to more effi- Hence, for more iron to be delivered to a cell by ferri-Tf ciently transport iron, or activating another transporter. the endosomes containing DMT1 must cycle into and DMT1 is a highly insoluble membrane protein making it out of the cell more rapidly. When iron is delivered by difficult to determine the effect of the facilitators on DMT1 transport activity in an in vitro system; however, a ferri-Tf the rate limiting step in iron uptake is the length of the transferrin cycle, that is the time for ferri-Tf to undergo endocytosis, release iron from Tf into the endo- some, and for the now apo-Tf still bound to the TfR to undergo exocytosis and be released from the TfR at the cell surface. If the facilitator shortened the length of the Tf cycle then DMT1 would be internalized more rapidly and the iron from Tf could be delivered faster. Inhibitors of iron uptake from ferri-Tf have been shown to adversely affect the Tf cycle [27]. In enterocytes we and others have shown that DMT1 is internalized upon expo- sure of the duodenum and Caco2 cells to Fe. Hence, increasing the rate of DMT1 internalization would also increase iron uptake in the enterocytes. While we presume that LS081 acts via DMT1 by alter- ing the kinetics of DMT1 internalization there are other routes for iron uptake that could be affected. For exam- ple, lipocalin (also known as NGAL or 24p3), the L-type Figure 5 The effect of LS081 on colony formation of PC3 Cells. Ca2+ channel, and Zip14, a member of zinc transporter PC-3 cells in 10% FCS-RPMI1640 were seeded at a density of 500 family, all have been demonstrated to be iron transpor- cells/well into 6-well plates. After 24 hrs, cells were treated with 0.1% DMSO, 3 or 10 μM LS081 ± 10 μM ferric ammonium citrate for ters or channels [28-30]. Whether these potential routes 48 hrs. The medium was replaced with 10% FCS-RPMI1640 and the of iron entry are affected by the iron facilitators is not cells were allowed to grow for ~ 10-14 days before Crystal violet known but these alternative minor routes for iron trans- staining and counting of colonies. Shown are the mean numbers of port function with NTBI and not with ferri-Tf and colonies ± SEM of 3-4 of independent observations with duplicates could not explain, therefore, how the facilitators affect or triplicates for each observation. **: P < 0.01 compared to either Fe alone or 3 μM LS081 alone; ***: p < 0.001 compared to Fe alone uptake from ferri-Tf. or 10 μM LS081 alone by 1-way ANOVA with Newman-Keuls’s Whatever the mechanism(s) by which iron uptake posttests. facilitation occurs the Fe that gains entry to the cell
- Li et al. Journal of Experimental & Clinical Cancer Research 2011, 30:34 Page 8 of 10 http://www.jeccr.com/content/30/1/34 Figure 6 The effect of LS081 on the expression of HIF1a and HIF2a. MDA-MB231 and DU145 cells were treated with 10 μM LS081 in 10% FCS-RPMI1640 ± 2 μM ferric ammonium citrate for 16 hr before harvesting for Western blot detection of HIF-1a and 2a as described in the Methods. The Western blots were quantitated by densitometry and the amounts of HIF as the ratio of HIF-1a or HIF-2a to the actin loading control were expressed relative to the DMSO control. The left panels are representative Western blots. A, HIF-1a was detected in DU145 cells cultured at 1% oxygen concentration (hypoxic). In B, HIF-2a was detected in MDA-MB231 cells grown in normal oxygen tension (21%). The right panels show the reduction of HIF-1a or -2a in the treated cells compared to control (means ± SEM of 3-4 experiments). *: p < 0.05; **: P < 0.01 compared to DMSO by 1-way ANOVA with Tukey’s posttests. therapeutic approach for cancer has been postulated by enters a pool of metabolically active iron as evidenced other investigators [31-33]. Some conventional che- by several observations. First, cellular ferritin levels motherapy agents such as melphalan, cisplatin, anthra- increased in the presence of LS081 whether iron was offered as non-Tf or Tf-bound iron. Second, HIF1a and cyclines, or bleomycin, are known to increase ROS by 2a protein expression was decreased. Third, the colony compromising the ROS scavenging capability of cancer cells [34-36]. Dicholoracetate, an inhibitor of pyruvate forming ability of prostate cancer cell lines was dehydrogenase kinase, stimulates ROS production and decreased. Fourth, LS081 increased the level of ROS. elicits apoptosis in cancer but not in normal cells [37]. It is interesting to consider the effects of iron facilita- Moreover, reducing ROS scavengers by inhibition of tion on the levels of ROS as a possible explanation for glutamate-cysteine ligase, the rate limiting enzyme in the decreased cell proliferation and clonogenicity we glutathione synthesis, increases radiosensitivity of cancer observed in cancer cells. ROS levels are increased in cells [38]. In addition, metal-binding compounds have cancer cells and it is possible that the additional ROS been considered to be potential anti-cancer agents and generation by LS081 exceeds cellular defences. Elevated have demonstrated anticancer activity [39]. Although ROS might then make LS081 treated cells more sensi- some compounds appear to act via metal chelation, tive to radiation therapy and radiomimetic drugs, a others appear to increase intracellular metal concentra- hypothesis that is being actively pursued. The idea of tions, suggesting different mechanisms of action. For disturbing the redox balance in cancer cells as a
- Li et al. Journal of Experimental & Clinical Cancer Research 2011, 30:34 Page 9 of 10 http://www.jeccr.com/content/30/1/34 example, clioquinol induces apoptosis of prostate cancer of primary screening. JG developed the strategy to screen for iron regulatory compounds and was involved in data analysis and manuscript revision. All cells by increasing intracellular zinc levels [40], and the authors read and approved the final manuscript. anti-malarial drug artemisinin has anti-cancer activity that may be mediated by Fe2+ and/or heme [41,42]. The Competing interests The authors declare that they have no competing interests. potential toxicity of excess of iron in cancer cells sug- gests the benefit of identifying molecules that promote Received: 21 January 2011 Accepted: 31 March 2011 iron uptake into cancer cells triggering more efficient Published: 31 March 2011 cell death. References Hypoxia is a common feature of most solid tumors 1. Arredondo M, Núñez MT: Iron and copper metabolism. Molecular Aspects with concomitant increased expression of the HIF-1a or of Medicine 2005, 26(4-5):313-327. HIF-2 a components of the HIF transcription factor 2. Eisenstein R: Iron regulatory proteins and the molecular control of mammalian iron metabolism. Annu Rev Nutr 2000, 20:627-662. [43,44]. Elevated levels of HIF-1a or HIF-2a are poor 3. McKie AT, Barrow D, Latunde-Dada GO, Rolfs A, Sager G, Mudaly E, prognostic indicators in a variety of tumors [45]. Under Mudaly M, Richardson C, Barlow D, Bomford A, et al: An Iron-Regulated normoxic conditions, both HIF-1a and -2a are hydroxy- Ferric Reductase Associated with the Absorption of Dietary Iron. Science 2001, 291(5509):1755-1759. lated by an iron-dependent prolyl hydroxylase (PHD), 4. Fleming MDTCr, Su MA, Foernzler D, Beier DR, Dietrich WF, Andrews NC: which requires a ferrous ion at the active site, with sub- Microcytic anaemia mice have a mutation in Nramp2, a candidate iron sequent hydroxylation ubiquitination by the von Hipple- transporter gene. Nat Genet 1997, 16(4):383-386. 5. Gunshin H, Mackenzie B, Berger UV, Gunshin Y, Romero MF, Boron WF, Lindau tumor suppressor (VHL) and then proteasome Nussberger S, Gollan JL, Hediger MA: Cloning and characterization of a degradation. Higher levels of intracellular iron could mammalian proton-coupled metal-ion transporter. Nature 1997, facilitate hydroxylation leading to increased ubiquitiza- 388(6641):482-488. 6. Donovan A, Brownlie A, Zhou Y, Shepard J, Pratt SJ, Moynihan J, Paw BH, tion and subsequent proteosome degradation of HIF-1a Drejer A, Barut B, Zapata A, et al: Positional cloning of zebrafish and -2a. HIF expression is important in cancer growth ferroportin1 identifies a conserved vertebrate iron exporter. Nature 2000, via several mechanisms including neo-vascularization. 403(6771):776-781. 7. Vulpe CD, Kuo YM, Murphy TL, Cowley L, Askwith C, Libina N, Gitschier J, While HIF-1a and -2a have been targets for drug devel- Anderson GJ: Hephaestin, a ceruloplasmin homologue implicated in opment [46,47] there is as yet no clinically active drug intestinal iron transport, is defective in the sla mouse. Nat Genet 1999, that specifically targets HIF expression. Presumably 21(2):195-199. 8. Yeh Ky, Yeh M, Mims L, Glass J: Iron feeding induces ferroportin 1 and LS081 induced reduction in HIF-1a and -2a is directly hephaestin migration and interaction in rat duodenal epithelium. Am J related to iron facilitation with increased activity of Physiol Gastrointest Liver Physiol 2009, 296(1):G55-65. PHD from increased cellular iron, an hypothesis sup- 9. Anderson G, Vulpe C: Mammalian iron transport. Cellular and Molecular Life Sciences 2009, 66(20):3241-3261. ported by loss of PHD activity and HIF1a stabilization 10. Nemeth E, Roetto A, Garozzo G, Ganz T, Camaschella C: Hepcidin is when cellular Fe uptake is limited by TfR knockdown decreased in TFR2 hemochromatosis. Blood 2005, 105(4):1803-1806. [48]. 11. Woodworth RCB-MA, Christensen TG, Witt DP, Comeau RD: An alternative model for the binding and release of diferric transferrin by reticulocytes. Biochemistry 1982, 21(18):4220-4225. Conclusions 12. Ohgami RS, Campagna DR, McDonald A, Fleming MD: The Steap proteins In summary, we identified a series of compounds cap- are metalloreductases. Blood 2006, 108(4):1388-1394. 13. Baynes RD, Bothwell TH: Iron Deficiency. Annual Review of Nutrition 1990, able of increasing iron uptake into cells. The lead com- 10(1):133-148. pound, LS081, facilitated iron uptake which resulted in 14. Scrimshaw N: Iron deficiency. Sci Am 1991, 265(4):46-52. reduced cancer cell growth, colony formation, and 15. Aikawa R, Khan NC, Sasaki S, Binns CW: Risk factors for iron-deficiency anaemia among pregnant women living in rural Vietnam. Public Health decreased HIF-1a and -2a protein levels, suggests that Nutrition 2006, 9(04):443-448. this class of compounds could be a useful anti-cancer 16. Maeda MYM, Yamauchi K: Prevalence of anemia in Japanese adolescents: 30 years’ experience in screening for anemia. Int J Hematol 1999, agent. In addition, the ability of these compounds to 69(2):75-80. affect iron uptake in a model system of intestinal iron 17. Woodman R, Ferrucci L, Guralnik J: Anemia in older adults. Current Opinion absorption suggests, also, that these compounds have a in Hematology 2005, 12(2):123-128. more general clinical utility for the management of iron 18. Brookes MJ, Hughes S, Turner FE, Reynolds G, Sharma N, Ismail T, Berx G, McKie AT, Hotchin N, Anderson GJ, et al: Modulation of iron transport deficiency. proteins in human colorectal carcinogenesis. Gut 2006, 55(10):1449-1460. 19. Omary MBTI, Minowada J: Human cell-surface glycoprotein with unusual properties. Nature 1980, 286(5776):888-891. Acknowledgements and Funding 20. Boult J, Roberts K, Brookes MJ, Hughes S, Bury JP, Cross SS, Anderson GJ, This study was supported by Feist-Weiller Cancer Center at Louisiana State Spychal R, Iqbal T, Tselepis C: Overexpression of Cellular Iron Import University Health Sciences Center-Shreveport and Message Pharmaceutical Proteins Is Associated with Malignant Progression of Esophageal Inc. Adenocarcinoma. Clinical Cancer Research 2008, 14(2):379-387. 21. Karihtala P, Soini Y: Reactive oxygen species and antioxidant mechanisms Authors’ contributions in human tissues and their relation to malignancies. APMIS 2007, ZL developed the screening techniques, designed and performed most of 115(2):81-103. the experiments and drafted the manuscript. HT performed and analysed 22. Rice-Evans C, Burdon R: Free radical-lipid interactions and their part of the screening validation experiments. FG engaged in data acquisition pathological consequences. Progress in Lipid Research 1993, 32(1):71-110.
- Li et al. Journal of Experimental & Clinical Cancer Research 2011, 30:34 Page 10 of 10 http://www.jeccr.com/content/30/1/34 23. Brown JX, Buckett PD, Wessling-Resnick M: Identification of Small 46. Semenza GL: Targeting HIF-1 for cancer therapy. Nat Rev Cancer 2003, Molecule Inhibitors that Distinguish between Non-Transferrin Bound 3(10):721-732. Iron Uptake and Transferrin-Mediated Iron Transport. Chemistry & Biology 47. Sowter HMRR, Moore JW, Ratcliffe PJ, Harris AL: Predominant role of 2004, 11(3):407-416. hypoxia-inducible transcription factor (Hif)-1alpha versus Hif-2alpha in 24. Wetli HA, Buckett PD, Wessling-Resnick M: Small-Molecule Screening regulation of the transcriptional response to hypoxia. Cancer Res 2003, Identifies the Selanazal Drug Ebselen as a Potent Inhibitor of DMT1- 63(19):6130-6134. Mediated Iron Uptake. Chemistry & Biology 2006, 13(9):965-972. 48. Eckard JDJ, Wu J, Jian J, Yang Q, Chen H, Costa M, Frenkel K, Huang X: 25. Buckett PD, Wessling-Resnick M: Small molecule inhibitors of divalent Effects of cellular iron deficiency on the formation of vascular metal transporter-1. Am J Physiol Gastrointest Liver Physiol 2009, 296(4): endothelial growth factor and angiogenesis. Iron deficiency and G798-804. angiogenesis. Cancer Cell Int 2010, 10(28). 26. Turturro Francesco FEaWT: Hyperglycemia regulates thioredoxin-ROS doi:10.1186/1756-9966-30-34 activity through induction of thioredoxin-interacting protein (TXNIP) in Cite this article as: Li et al.: Anticancer activity of the iron facilitator metastatic breast cancer-derived cells MDA-MB-231. BMC Cancer 2007, LS081. Journal of Experimental & Clinical Cancer Research 2011 30:34. 7(96):7. 27. Horonchik L, Wessling-Resnick M: The Small-Molecule Iron Transport Inhibitor Ferristatin/NSC306711 Promotes Degradation of the Transferrin Receptor. Chemistry & Biology 2008, 15(7):647-653. 28. Yang J, Goetz D, Li JY, Wang W, Mori K, Setlik D, Du T, Erdjument- Bromage H, Tempst P, Strong R, et al: An Iron Delivery Pathway Mediated by a Lipocalin. Molecular Cell 2002, 10(5):1045-1056. 29. Ludwiczek S, Theurl I, Muckenthaler MU, Jakab M, Mair SM, Theurl M, Kiss J, Paulmichl M, Hentze MW, Ritter M, et al: Ca2+ channel blockers reverse iron overload by a new mechanism via divalent metal transporter-1. Nat Med 2007, 13(4):448-454. 30. Liuzzi JP, Aydemir F, Nam H, Knutson MD, Cousins RJ: Zip14 (Slc39a14) mediates non-transferrin-bound iron uptake into cells. Proceedings of the National Academy of Sciences 2006, 103(37):13612-13617. 31. Pelicano H, Carney D, Huang P: ROS stress in cancer cells and therapeutic implications. Drug Resistance Updates 2004, 7(2):97-110. 32. Fruehauf JP, Meyskens FL: Reactive Oxygen Species: A Breath of Life or Death? Clinical Cancer Research 2007, 13(3):789-794. 33. Trachootham D, Lu W, Ogasawara MA, Valle NR-D, Huang P: Redox Regulation of Cell Survival. Antioxidants & Redox Signaling 2008, 10(8):1343-1374. 34. Witte A-B, Anestål K, Jerremalm E, Ehrsson H, Arnér ESJ: Inhibition of thioredoxin reductase but not of glutathione reductase by the major classes of alkylating and platinum-containing anticancer compounds. Free Radical Biology and Medicine 2005, 39(5):696-703. 35. Miyajima ANJ, Yoshioka K, Tachibana M, Tazaki H, Murai M: Role of reactive oxygen species in cis-dichlorodiammineplatinum-induced cytotoxicity on bladder cancer cells. Br J Cancer 1997, 76(2):206-210. 36. Hug H, Strand S, Grambihler A, Galle J, Hack V, Stremmel W, Krammer PH, Galle PR: Reactive Oxygen Intermediates Are Involved in the Induction of CD95 Ligand mRNA Expression by Cytostatic Drugs in Hepatoma Cells. Journal of Biological Chemistry 1997, 272(45):28191-28193. 37. Bonnet S, Archer SL, Allalunis-Turner J, Haromy A, Beaulieu C, Thompson R, Lee CT, Lopaschuk GD, Puttagunta L, Bonnet S, et al: A Mitochondria-K+ Channel Axis Is Suppressed in Cancer and Its Normalization Promotes Apoptosis and Inhibits Cancer Growth. Cancer Cell 2007, 11(1):37-51. 38. Diehn MCR, Lobo NA, Kalisky T, Dorie MJ, Kulp AN, Qian D, Lam JS, Ailles LE, Wong M, Joshua B, Kaplan MJ, Wapnir I, Dirbas FM, Somlo G, Garberoglio C, Paz B, Shen J, Lau SK, Quake SR, Brown JM, Weissman IL, Clarke MF: Association of reactive oxygen species levels and radioresistance in cancer stem cells. Nature 2009, 458(7239):780-783. 39. Brabec V, Nováková O: DNA binding mode of ruthenium complexes and relationship to tumor cell toxicity. Drug Resistance Updates 2006, 9(3):111-122. 40. Yu H, Zhou Y, Lind SE, Ding WQ: Clioquinol targets zinc to lysosomes in Submit your next manuscript to BioMed Central human cancer cells. Biochem J 2009, 417(1):133-139. 41. Efferth T: Mechanistic perspectives for 1,2,4-trioxanes in anti-cancer and take full advantage of: therapy. Drug Resistance Updates 2005, 8(1-2):85-97. 42. Moore JCLH, Li JR, Ren RL, McDougall JA, Singh NP, Chou CK: Oral • Convenient online submission administration of dihydroartemisinin and ferrous sulfate retarded implanted fibrosarcoma growth in the rat. Cancer Lett 1995, 98(1):83-87. • Thorough peer review 43. Brown JM, Giaccia AJ: The Unique Physiology of Solid Tumors: • No space constraints or color figure charges Opportunities (and Problems) for Cancer Therapy. Cancer Research 1998, • Immediate publication on acceptance 58(7):1408-1416. 44. Höckel MVP: Biological consequences of tumor hypoxia. Semin Oncol • Inclusion in PubMed, CAS, Scopus and Google Scholar 2001, 28(2 Suppl 8):36-41. • Research which is freely available for redistribution 45. Harris AL: Hypoxia [mdash] a key regulatory factor in tumour growth. Nat Rev Cancer 2002, 2(1):38-47. Submit your manuscript at www.biomedcentral.com/submit
CÓ THỂ BẠN MUỐN DOWNLOAD

-

Báo cáo khoa học: Vitamin D stimulates apoptosis in gastric cancer cells in synergy with trichostatin A ⁄sodium butyrate-induced and 5-aza-2¢-deoxycytidine-induced PTEN upregulation
 11 p |
  44
|
44
|  5
5
-
Báo cáo khoa học: Curcumin suppresses the dynamic instability of microtubules, activates the mitotic checkpoint and induces apoptosis in MCF-7 cells
12 p | 54
| 5
-
Báo cáo khoa học: Possible binding site for paclitaxel at microtubule pores
12 p | 28
| 4
-

Báo cáo khoa học: The role of antioxidants in the cytotoxicity of chemotherapeutic drugs
7 p | 57
| 4
-

Báo cáo khoa học: IFN-c enhances TRAIL-induced apoptosis through IRF-1
7 p | 48
| 4
-
Báo cáo khóa học: The transporters Pdr5p and Snq2p mediate diazaborine resistance and are under the control of the gain-of-function allele PDR1-12
8 p | 39
| 3
-

Báo cáo khoa học: nNOS inhibition, antimicrobial and anticancer activity of the amphibian skin peptide, citropin 1.1 and synthetic modifications
13 p | 38
| 3
-
Báo cáo y học: "Anticancer Activity of the PR Domain of Tumor Suppressor RIZ1"
7 p | 51
| 2
-

Báo cáo khoa học: Lipopolyamine treatment increases the efficacy of intoxication with saporin and an anticancer saporin conjugate
12 p | 29
| 2


Chịu trách nhiệm nội dung:
Nguyễn Công Hà - Giám đốc Công ty TNHH TÀI LIỆU TRỰC TUYẾN VI NA
LIÊN HỆ
Địa chỉ: P402, 54A Nơ Trang Long, Phường 14, Q.Bình Thạnh, TP.HCM
Hotline: 093 303 0098
Email: support@tailieu.vn
Giấy phép Mạng Xã Hội số: 670/GP-BTTTT cấp ngày 30/11/2015 Copyright © 2022-2032 TaiLieu.VN. All rights reserved.

