


Báo cáo khoa học: "Genetic variability of a scattered temperate forest tree: Sorbus torminalis L. (Crantz)"
lượt xem 4
download
 Download
Vui lòng tải xuống để xem tài liệu đầy đủ
Download
Vui lòng tải xuống để xem tài liệu đầy đủ
Tuyển tập các báo cáo nghiên cứu về lâm nghiệp được đăng trên tạp chí lâm nghiệp quốc tế đề tài: Genetic variability of a scattered temperate forest tree: Sorbus torminalis L. (Crantz)...
Bình luận(0) Đăng nhập để gửi bình luận!
Nội dung Text: Báo cáo khoa học: "Genetic variability of a scattered temperate forest tree: Sorbus torminalis L. (Crantz)"
- 63 Ann. For. Sci. 57 (2000) 63–71 © INRA, EDP Sciences 2000 Original article Genetic variability of a scattered temperate forest tree: Sorbus torminalis L. (Crantz) Brigitte Demesurea,*, Bénédicte Le Guerrouéa, Géraldine Lucchia, Daniel Pratb and Rémy-Jacques Petitc a Conservatoiregénétique des arbres forestiers, Office National des Forêts, Campus INRA, F-45160 Ardon, France b Laboratoirede génétique et amélioration des arbres forestiers, INRA, F-45160 Ardon, France c Laboratoire de génétique des arbres forestiers, INRA, BP. 45, F-33611 Gazinet Cedex, France (Received 20 January 1999; accepted October 4, 1999) Abstract – Genetic variation has been assessed in 73 (mostly French) populations of the wild service tree (Sorbus torminalis) using 15 isozymes loci. In spite of a relatively high coefficient of genetic differentiation among populations (FST = 15%), only a weak geo- graphical structure was detected. This may be explained by the small size and young age of the populations due to the importance of founder effects, combined with the high levels of seed flow among populations. These features are typical of species characterised by metapopulation dynamics. genetic diversity / differentiation / metapopulation / Rosaceae / spatial structure Résumé – Variabilité génétique d’une espèce forestière disséminée : Sorbus torminalis L. (Crantz). De nombreuses études se sont intéressées à la diversité génétique des plantes rares, menacées de disparition, ou à celles largement répandues qui présentent un grand intérêt économique. Par contre, le cas des espèces ayant une aire de répartition importante mais présentant des densités faibles reste peu abordé, en particulier chez les arbres forestiers. Dans les forêts tempérées, les arbres forestiers disséminés occupent une place secondaire. L’alisier torminal (Sorbus torminalis) est une espèce fruitière disséminée au comportement post-pionnier nomade. Ses graines sont dispersées par les oiseaux. 67 populations françaises et 6 populations d’Europe centrale ont été étudiées à l’aide des isozymes. Une forte différentiation entre populations a été trouvée (FST = 15 %), combinée à une faible structuration géographique. Ceci peut s’expliquer par les effets de fondation importants liés au comportement écologique de l’espèce, et aux flux de graines entre populations éloignées, liés à la dissémination par des oiseaux. Le modèle en métapopulation, avec des populations subissant des phé- nomènes de colonisation et d’extinction, mais restant interconnectées par des flux de gènes, semble particulièrement bien s’appliquer à cette espèce. Au vu de ces résultats, une gestion permettant l’implantation de l’alisier dans de nouveaux sites pouvant recevoir des flux de gènes des populations préexistantes doit être encouragée. Rosaceae / diversité génétique / métapopulation / differentiation / structure spatiale 1. INTRODUCTION regions. These studies have pointed out the importance of the size of the geographic range of the species for Since the development of isozyme markers, thou- predicting levels and organisation of genetic diversity: sands of population genetic studies of wild plants, in general, species with widespread distributions main- including a large proportion dealing with forest trees, tain higher levels of genetic diversity at allozyme loci have been carried out either in temperate or in tropical than species with narrow or endemic distribution [10, * Correspondence and reprints demesure@orleans.inra.fr
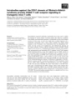
- 64 B. Demesure et al. 11, 32]. Similarly, allozyme surveys have shown that Sorbus aria, another diploid species, is considered to be geographically restricted species that are locally abun- frequent in Europe [9]. dant contain fewer polymorphic loci and a lower mean number of alleles per locus than widespread congeneric species [14, 15]. The importance of the size of the popu- 2. MATERIALS AND METHODS lation has also been investigated for a more limited num- 2.1. Materials ber of plant species. These studies have shown that common species with large population sizes are more Sixty seven indigenous populations of Sorbus tormi- variable than rare species [37]. However, little is known nalis were sampled in France (figure 1). The collection about trees with widespread distribution but having low also included six populations originating from other population densities, i.e. between 0.1 and 30 adults by countries in Europe: Slovakia (3 populations), Slovenia, hectare. This lack of knowledge is due first to the low Bulgaria, and Switzerland (one population each) economic impact of these species compared to social for- (table I). A population sample consists of dormant buds est trees such as Quercus spp. or Picea abies in Europe from at least 11 mature trees or young stems separated and second to the difficulty to inventory them. Yet the from each other by at least 50 m (to avoid sampling the scattered trees contribute to increase the biodiversity of same clone) on an area of 20 to 50 ha. In such conditions the forest, by their presence but also because many ani- the sampling of individuals may or not be exhaustive, mal species rely on them. depending on the local density. To allow comparisons among regions, French populations were grouped Nevertheless, some results concerning genetic diversi- according to their geographical proximity. Several geo- ty of disseminated trees based on enzymes have started graphical clustering of populations were tested. The to appear recently both in temperate countries [22, 30, results of gene diversity and differentiation were very 33, 40] as well as in tropical ones [4, 15, 37]. These similar. The final choice (eight groups) resulted from a species generally show lower genetic diversity than compromise between homogeneous number of popula- widespread species. But comparisons with more abun- tions per group and geographical proximity (figure 1). dant species are difficult, because sampling of scattered species often involves few populations with limited sam- ple sizes per population. Here, we present the results of an investigation of the genetic variability of a scattered tree species, the wild service tree, Sorbus torminalis (L.) Crantz, based on an intensive sampling of populations in France. This member of the Rosaceae family is one of the most economically important wild fruit trees in Europe. It is a scattered species (0.1 to 30 adults per hectare) which never occurs in pure populations. It grows on all types of soils. It is a post-pioneer tree that colonises disturbed areas and forest edges. Although the trees are generally overgrown by more competitive species such as Quercus or Fagus [5], individual trees can be very valuable when they benefit from good soil and light conditions. S orbus torminalis is a diploid species (2 n = 34) according to Liljefors [20]. This species is insect pollinated and the seeds are dispersed by birds. A recent study on Sorbus commixta in Japan [45] reports that extraction of seeds from the pulp is nec- essary for their germination. Sorbus torminalis is also able to propagate asexually through the production of suckers. The natural distribution of Sorbus torminalis is rather large, from the north of Magrehb to the south of Sweden and from the east of Great Britain to the north of Fig.1. Geographical distribution of populations of Sorbus tormi- Iran. It grows mostly in lowlands. In France, the most nalis. Populations were clustered in 8 groups according to their important populations of Sorbus torminalis are located in geographical proximity. Symbols for the groups are group 1 s, group 2 w, group 3 q, group 4 x, group 5 5, group 6 q, group the south-west and in the north-east of the country. 7 v, group 8 5. Hybridisation with other Sorbus species, especially with
- 65 Allozyme diversity in Sorbus torminalis Table I. Geographic origin, and genetic diversity estimates and inbreeding coefficient (based on 15 allozyme loci) for 73 popula- tions of Sorbus torminalis. Na, number of alleles per locus; Ho, observed heterozygosity; He, expected heterozygosity; FIS, heterozygote deficit. Populations Longitude Lattitude Groups Sample size Na Ho He FIS Assenoncourt 06°45'E 48°47'N 8 21 1.600 0.116 0.151 0.232 Aulnay 00°28'E 46°00'N 4 19 1.733 0.175 0.179 0.022 Avants Monts 02°41'E 43°26'N 5 12 1.333 0.100 0.080 –0.250 Bellême 00°31'E 48°24'N 3 11 1.533 0.145 0.164 0.116 Bercé 05°02'E 45°08'N 3 18 1.667 0.130 0.175 0.257 Bois rogue 00°13'W 46°59'N 4 20 1.600 0.105 0.173 0.393 Bourdogne 00°25'E 47°48'N 7 20 1.800 0.157 0.197 0.203 Bourg St Andéol 04°34'E 44°25'N 6 18 1.600 0.126 0.135 0.067 Braconne 00°20'W 46°30'N 4 20 1.600 0.149 0.169 0.118 Byans sur le Doubs 05°49'E 47°05'N 8 19 1.533 0.128 0.120 –0.067 Canjuers 06°25'E 43°38'N 6 20 1.533 0.135 0.153 0.118 Chantilly 02°29'E 49°10'N 1 20 1.800 0.186 0.200 0.070 Charve Chave 03°22'E 46°00'N 7 19 1.667 0.116 0.150 0.227 Chatrices 04°57'E 49°01'N 8 14 1.733 0.177 0.201 0.119 Chillou 00°39'E 46°35'N 4 20 1.733 0.137 0.186 0.263 Chizé 00°17'W 46°03'N 4 20 1.733 0.137 0.230 0.404 Choeurs Bommiers 02°00'E 46°51'N 2 21 1.600 0.139 0.202 0.312 Chouanière 01°21'W 47°53'N 3 20 1.667 0.143 0.152 0.059 Claix 00°02'E 45°32'N 4 20 1.600 0.113 0.146 0.226 Corbières Occidentales 02°17'E 43°02'N 5 23 1.733 0.142 0.160 0.113 Croix aux bois 04°47'E 49°18'N 1 20 1.533 0.107 0.127 0.157 Crugny 03°44'E 49°16'N 1 19 1.467 0.123 0.147 0.163 Dreux 01°23'E 48°46'N 2 20 1.667 0.133 0.161 0.174 Ferrières 02°43'E 48°50'N 2 26 1.600 0.120 0.164 0.268 Fontainebleau 02°37'E 48°25'N 2 18 1.447 0.095 0.093 –0.022 Fossemanant 02°08'E 49°49'N 1 22 1.667 0.144 0.170 0.153 Gardiole 05°41'E 43°34'N 6 19 1.600 0.126 0.122 –0.033 Gatinalière 00°20'E 46°59'N 4 21 1.600 0.169 0.152 –0.112 Gâvre 01°50'W 47°31'N 3 20 1.667 0.157 0.165 0.048 Gouffern 00°01'W 48°49'N 3 20 1.800 0.155 0.181 0.144 Grand Vallon 06°04'E 44°11'N 6 13 1.467 0.082 0.119 0.311 Grésigne 01°44'E 44°02'N 5 15 1.600 0.132 0.160 0.175 Guerche 01°14'W 47°52'N 3 20 1.733 0.133 0.168 0.208 Gurs 00°48'W 43°15'N 5 15 1.667 0.129 0.143 0.098 Harth 07°23'E 47°46'N 8 20 1.800 0.234 0.223 –0.049 Hez Froidemont 02°16'E 49°24'N 1 20 1.733 0.147 0.142 –0.035 Hospice de Chalais 00°04'W 45°14'N 4 20 1.600 0.137 0.132 –0.038 Hurecourt 06°02'E 47°55'N 8 12 1.533 0.162 0.164 0.012 Isle s/le Doubs 06°34'E 47°26'N 8 18 1.667 0.141 0.188 0.250 Le Plan 01°05'E 43°08'N 5 12 1.600 0.106 0.150 0.293 Liffré 01°28'W 48°13'N 3 20 1.667 0.103 0.144 0.285 Malmifait 01°56'E 49°35'N 1 20 1.600 0.144 0.156 0.077 Mareuil 00°31'E 46°34'N 4 17 1.733 0.170 0.191 0.110 Mas d'agenais 00°09'E 44°24'N 5 22 1.533 0.123 0.156 0.212 Montceau 04°21'E 47°29'N 2 13 1.600 0.122 0.161 0.242 Mouliére 00°32'E 46°49'N 4 19 1.667 0.221 0.186 –0.188 Nanc les St Amour 05°17'E 46°25'N 7 13 1.467 0.154 0.142 –0.085 Orléans 01°52'E 47°56'N 2 21 1.533 0.083 0.185 0.551 Pleumartin 00°52'E 46°37'N 4 19 1.667 0.155 0.173 0.104 Puygareau 00°17'E 46°50'N 4 22 1.667 0.144 0.197 0.269 Rambouillet 01°47'E 48°40'N 2 21 1.667 0.125 0.163 0.233 Ravières 04°16'E 47°44'N 2 22 1.800 0.128 0.189 0.323 Roche de bran 00°28'E 46°42'N 4 20 1.667 0.153 0.173 0.116 Roche posay 00°44'E 46°47'N 4 19 1.667 0.151 0.162 0.068 Rouvroy sur Marne 05°29'E 48°23'N 8 20 1.600 0.173 0.170 –0.018 St André 00°13'W 48°52'N 3 20 1.533 0.097 0.131 0.260
- 66 B. Demesure et al. Table I. Continued. Populations Longitude Lattitude Groups Sample size Na Ho He FIS St Babel 03°16'E 45°34'N 7 14 1.533 0.167 0.150 –0.113 St Gobain 03°50'E 49°35'N 1 11 1.467 0.061 0.134 0.545 St Vallier 06°08'E 48°10'N 8 24 1.667 0.127 0.175 0.274 Ternay 00°21'W 47°08'N 4 20 1.533 0.114 0.140 0.186 Trois Fontaines 04°55'E 48°46'N 8 14 1.600 0.178 0.192 0.073 Valay 05°38'E 47°20'N 8 30 1.533 0.151 0.151 0.000 Valbonne 04°34'E 44°16'N 6 19 1.467 0.086 0.120 0.283 Vendresse 04°46'E 49°37'N 1 16 1.733 0.154 0.166 0.072 Vierzon 02°27'E 47°10'N 2 21 1.467 0.095 0.118 0.195 Villasavary 01°59'E 43°13'N 5 15 1.533 0.102 0.090 –0.133 Wasselone 07°25'E 48°36'N 8 11 1.467 0.108 0.113 0.044 Central Europe Bulgarie 27°05'E 43°18'N EC 20 1.733 0.105 0.117 0.103 Slovaquie 1 21°36'E 49°07'N EC 42 1.667 0.070 0.100 0.300 Slovaquie 2 19°18'E 48°30'N EC 34 1.800 0.152 0.139 –0.094 Slovaquie 3 21°03'E 48°48N EC 65 1.800 0.127 0.143 0.112 Slovénie 13°26'E 45°16'N EC 29 1.600 0.123 0.122 –0.008 Suisse 09°04'E 45°30'N EC 86 1.800 0.152 0.179 0.151 2.2. Electrophoresis staining procedures [2, 28, 39, 42] were adapted with some minor modifications. Segregation analysis of poly- morphic systems (Demesure and Le Guerroué, unpub- The buds sampled (3 to 5 per tree) were ground in a lished data) showed that these enzymes were encoded by cooled mortar containing the protein extraction buffer 15 loci. The alleles were numbered from the fastest to (360 µL for 200 mg of plant material), which was a Tris- the slowest. HCl buffer (0.02 M, pH = 7.6) supplemented with 1.0% bovine serum albumin, 2% polyethyleneglycol 8000, 1% dithiothreitol, 14 µ M β -mercaptoethanol. The 2.3. Data analysis homogenates were centrifuged at 15 000 g for 20 min at 4 °C. The extracts were stored at –80 °C until analysis. Geographical variation of gene diversity and allele The electrophoretic migration took place at 4 °C in hori- frequencies were tested in different ways. Several zontal starch gels under an electric field of 80 mV cm–1 genetic diversity parameters were calculated, for all for one night. French populations, but also for each regional group. In Of the l8 enzyme systems tested (some were tested addition, a comparison between the French populations with various substrates and staining procedures) the fol- and the Central European ones was carried out. Allele lowing 11 were finally retained because of the repro- frequencies were calculated for each population and gene ducible patterns and of the straightforward genetic diversity parameters estimated on a within population interpretations: AAP, E.C. 3.4.11.1 (alanine aminopepti- basis. The number of alleles per locus (Na) was calculat- dase, one locus: A AP -1), A CP , E.C. 3.1.3.2 (acid ed over all the loci, as well as Nei's genetic diversity phospatase, one locus: ACP-1), ADH, E.C. 1.1.1.1 (alco- indices [26, 27]. Population differentiation can be sum- hol dehydrogenase, one locus: A DH -1), G OT , E.C. marised by F-statistics (FIS, FST) as defined by Wright 2.6.1.1 (glutamate oxaloacetate transaminase, one locus: [44], for groups of populations [13]. The similarity GOT-2), IDH, E.C. 1.1.1.42 (isocitrate dehydrogenase, between pairs of populations was measured by Nei’s two loci: IDH-1, IDH-2), PRX, E.C. 1.11.1.7 (peroxi- unbiased genetic distances corrected for small sample dase, two loci: PRX-1, PRX-2), ME E.C. 1.1.1.40 (malic sizes [27]. Dendrograms were produced based on this enzyme, one locus: ME-1), MR E.C. 1.6.99.2 (mena- distance using the UPGMA method [13]. All estimators dione reductase, two loci: MR-1, M R-2), PGM, E.C. of the parameters of interest (allele frequencies, genetic 5.4.2.2 (phosphoglucomutase, two loci: PGM-1, PGM- diversity and differentiation) were computed using POP- 2), 6PGD E.C. 1.1.1.44 (6-phosphogluconate dehydroge- GENE 1.2 [46]. Another useful parameter to evaluate nase, one locus: 6PGD-1) SKDH, E.C. 1.1.1.25 (shiki- differences in levels of diversity H across populations is mate dehydrogenase, one locus: S KDH -1). Standard the coefficient of variation of H (standard deviation of H
- 67 Allozyme diversity in Sorbus torminalis divided by the mean). One-way analysis of variance was Table II. Genetic diversity estimates per locus among the French populations and the Central European ones. Na, number used to investigate the difference between groups of pop- of alleles per locus; Ho, observed heterozygosity; He, expected ulations, based on the parameters estimated in each indi- heterozygosity; FIS, heterozygote deficit; FST differentiation vidual population. For each parameter (Na, Ho, He and coeficient; SD, standard deviation. FIS) considered, we therefore tested whether significant (P < 0.05) differences occurred among groups. For the France Locus Na Ho He FIS FST comparison between France and Central Europe, stan- ADH 4 0.421 0.473 –0.00 0.11 dard errors of diversity parameters were based on the ACP 1 – – – – sampling of loci. 6-PDH 2 0.361 0.393 –0.03 0.12 Multivariate analyses (factorial analysis) based on the PRX-1 2 0.102 0.296 0.56 0.24 presence or absence of each detected allele at each locus PRX-2 2 0.094 0.131 0.22 0.10 ME 3 0.488 0.647 0.15 0.11 were also performed. For each allele in each individual, SKDH 2 0.031 0.130 0.62 0.32 the data was coded as 2, 1 or 0 when the allele was AAP 2 0.082 0.155 0.25 0.27 observed in the homozygous condition, in the heterozy- IDH-1 2 0.099 0.106 –0.04 0.11 gous condition or not observed, respectively. In order to IDH-2 1 – – – – assess the effect of geographical distances between PGM-1 1 – – – – populations on their genetic distances, multilocus genetic PGM-2 5 0.382 0.521 0.13 0.16 MR-1 1 – – – – distances were computed between all pairs of popula- MR-2 1 – – – – tions, following Degen and Scholz [3]. All pairs of popu- GOT-2 1 – – – – lations were then classified in ten geographic distance classes from 0 to 1000 km, and the relationship between Mean 2.0 0.137 0.190 0.15 0.15 genetic and geographical distances was tested against the SD 1.2 0.178 0.221 hypothesis of random spatial genetic structure by permu- tation analysis [3]. Central Europe ADH 3 0.319 0.317 –0.01 0.04 ACP 1 – – – – 6-PDH 2 0.291 0.288 –0.15 0.07 3. RESULTS PRX-1 2 0.048 0.207 0.77 0.14 PRX-2 2 0.022 0.029 0.41 0.02 3.1. Overall genetic variability of Sorbus torminalis ME 4 0.565 0.629 0.03 0.12 in France SKDH 2 0.026 0.047 0.40 0.05 AAP 2 0.008 0.030 0.60 0.03 Nine of the 15 loci were polymorphic in France IDH-1 2 0.118 0.117 –0.04 0.03 IDH-2 1 – – – – (table II), with a range of 5 to 9 polymorphic loci in each PGM-1 1 – – – – population. The number of alleles per polymorphic locus PGM-2 5 0.428 0.529 0.13 0.06 ranged from 2 to 5 with a mean of 2.0. In France, the MR-1 1 – – – – average of observed and expected heterozygosities were MR-2 1 – – – – respectively 0.137 and 0.190 (table II). The FIS values GOT-2 3 0.125 0.131 –0.07 0.10 were positive at six loci and negative at three other ones Mean 2.1 0.130 0.155 0.09 0.08 (ADH, 6-PDH, IDH-1): the combined value over all loci SD 1.2 0.411 0.203 was 0.15. The coefficient of differentiation among popu- lations, FST, ranged from 0.10 to 0.32 across loci, with an overall value of 0.15 (table II). The coefficient of variation of H across all 73 populations was 0.20. Most alleles were found throughout France. However, allele e of PGM-2 was only observed in the Pyrénées respectively. Here, the analysis of variance revealed (group 5) and allele d of ADH was restricted to north of significant differences among groups (P = 0.02 for Ho France (group 1). In addition, allele b of AAP was absent and P = 0.01 for He). The mean within-population het- in group 5 and allele b of S KDH was absent erozygote deficit (FIS) ranged from 0.07 (group 7) to from group 1. The mean number of alleles per group 0.28 (group 2), with no significant differences among (table III) varied very little: from 1.53 (group 6) to 1.60 groups. The coefficient of genetic differentiation (FST) (group 2), and no significant group effect was detected was computed in each of the eight groups. It ranged from by the analysis of variance. Observed and expected het- 0.08 in Brittany (group 3) to 0.15 in the southwest of erozygosities ranged from 0.111 (group 6) to 0.154 (group 8), and from 0.130 (group 6) to 0.172 (group 4) France (group 4).
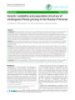
- 68 B. Demesure et al. Table III. Genetic diversity measures within the 8 French groups and the central European group. Region Na Ho He FIS FST Group 1 (SD) 1.62 (0.13) 0.133 (0.037) 0.155 (0.023) 0.14 (0.17) 0.10 Group 2 (SD) 1.60 (0.11) 0.115 (0.020) 0.160 (0.034) 0.28 (0.15) 0.12 Group 3 (SD) 1.66 (0.09) 0.133 (0.022) 0.160 (0.017) 0.17 (0.09) 0.08 Group 4 (SD) 1.65 (0.07) 0.147 (0.029) 0.172 (0.024) 0.14 (0.16) 0.15 Group 5 (SD) 1.58 (0.14) 0.119 (0.018) 0.131 (0.036) 0.09 (0.20) 0.11 Group 6 (SD) 1.53 (0.07) 0.111 (0.025) 0.130 (0.014) 0.14 (0.15) 0.11 Group 7 (SD) 1.62 (0.15) 0.149 (0.022) 0.160 (0.025) 0.07 (0.18) 0.10 Group 8 (SD) 1.61 (0.10) 0.154 (0.036) 0.168 (0.033) 0.08 (0.12) 0.11 Central Europe (SD) 1.73 (0.08) 0.122 (0.031) 0.133 (0.027) 0.09 (0.13) 0.08 Overall mean (SD) 1.63 (0.10) 0.134 (0.031) 0.156 (0.030) 0.13 (0.15) 0.15 Na, number of alleles per locus; Ho, observed heterozygosity; He, expected heterozygosity; FIS, heterozygote deficit; FST differentiation coeficient; SD, standard deviation. 3.2. Comparison of French populations with tions and a comparatively high level of genetic diversity. central European populations The estimates of genetic variation at the species level that we obtained in S. torminalis (P = 66%, A = 2.20, Ten of the 15 loci were polymorphic in Europe H e = 0.185) were very close to those obtained by (table II). The locus GOT-2 was polymorphic only in 3 Hamrick et al. [11] in long-lived woody perennials populations (two in Slovakia and one in Bulgaria). One (P = 65%, A = 2.22, He = 0.177). Similarly, at the within rare allele appears in the eastern European populations at population level, results for S. torminalis (P = 57%, the locus M E . There were no consistent differences A = 1.62, He = 0.156 ) are very close to those of the other between the French and the Central European popula- trees (P = 49%, A = 1.76, He = 0.148). The diversity val- tions groups (table III). It can be noticed that the number ues for S . torminalis are however lower than those of alleles is slightly higher (2.1) and the value of the FST obtained by Raspé et al. for Sorbus aucuparia in Europe (0.08) lower for the eastern European populations than [33] within population (P = 63%, A = 2.25, He = 0.212) for the French populations ( table II ). However, the and within species (P = 90%, A = 3.70, He = 0.229). The analysis of variance based on the differences across loci difference observed between the two species may be did not detect any significant differences between the explained by ecological differences and postglacial his- French populations and Central European ones. tory. Indeed Sorbus aucuparia grows in relatively wet and cool climate, consequently it is confined to mountain areas in the southernmost part of its range, and it can be 3.3. Geographic structuring of the diversity found at high latitudes. On the other hand, Sorbus tormi- in France nalis is found in drier habitats, in the plains at lower lati- tudes, and is absent at high altitudes. Hence, it is likely The UPGMA dendrogram using Nei's unbiased dis- that during the last ice-age the climate was more adapted tance (figure 2) did not reveal any clustering of geo- to Sorbus aucuparia which could persist in numerous graphically close populations. A multivariate analysis small populations in glacial refugia, and maintain higher indicates the same lack of geographic structure (data not levels of diversity. Our results for S. torminalis indicate shown). However, the analysis of the correlation that the genetic diversity is equally distributed in France. between Nei’s genetic distances and geographic dis- No strong differences can be noted for the mean number tances revealed a slight but significant positive relation- of alleles per population. The coefficient of variation of ship at distances up to 120 km (figure 3). H (0.20) is only slightly larger than that observed in a compilation of 62 outcrossing tree species (0.17) (R.J. Petit, in prep.), indicating that levels of diversity are not 4. DISCUSSION especially heterogeneous. Although still small compared to herbaceous species, the observed FST value (0.15) is Our results for the wild service tree are consistent however higher than that reported in other forest tree with those obtained for allozyme markers in most forest species (e.g., F ST = 0.06 for S . aucuparia , [33]; trees studied to date: little differentiation among popula-
- 69 Allozyme diversity in Sorbus torminalis Fig 3. Genetic distogram (genetic distances versus geographic distances) for 9 distance classes (0–900 km), and 95% confi- dence intervals of the genetic distance, computed by means of 1000 permutations. the value observed in Sorbus torminalis. Interestingly, other authors have also reported relatively high FST val- ues for scattered species having small populations: 0.33 for Ulmus laevis [23], 0.18 for Ulmus minor [21], 0.13 for Acer platanoides [34], 0.13 for Ocotea tenera [7], 0.20 for Alnus glutinosa [30]. Allozyme studies show clearly that population subdivision promotes differentia- tion: values of FST are higher in subdivided than in con- tinuous habitats [1, 31]. Most disseminated tree species are not randomly mating, due to their scattered distribu- tion and pollination by vectors which fly over short dis- tances only [19]. Therefore genetic drift can have a great importance in their evolution. Although Sorbus tormi- nalis seems to be mainly outcrossing, as suggested by the small heterozygote deficit in the populations, a rapid divergence between populations can appear. The high F ST value can also be explained by founder effects. Indeed, S. torminalis is a nomad species and its popula- tions have a rapid turnover. Theoretical studies have shown that founding events may increase differences between young populations, depending notably on the number of individuals involved in the founding events and the number of source populations from wich they are Fig. 2. UPGMA clustering of 67 populations of Sorbus tormi- drawn [41]. nalis based on Nei’s genetic distance. Hence, the major result of this study is the combina- tion of the relatively high FST and the weak geographic structure. The distogram indicates that populations sepa- FST = 0.03 for Quercus petraea, [47]; FST = 0.05 for rated by less than 150 km are more related than those Prunus avium, [6]). It is also of comparable magnitude further apart, but the other analyses have failed to detect to the estimate obtained Prat & Daniel in a previous any geographic structure at the monolocus level. more limited study of the species (F ST = 0.10) [29]. Paradoxically, some comparable studies in forest trees According to Hamrick et al. [11], the mean FST for trees have found low FST values combined with a strong geo- with animal-dispersed seeds (0.05) is much lower than graphic structure at the multilocus level [16] or even at
- 70 B. Demesure et al. the monolocus level [17]. Studies of the genetic conse- Acknowledgements: W e would like to thank the numerous technicians of the French National Forest quences of population dynamics within a forest but also Office, as well as D. Gömory, R. Longauer, P. Rotach, over a larger scale, will be necessary to clarify this V. Hynek, R. Brus and P. Jevel who collected the Sorbus finding in order to examine how populations are inter- samples. This study has been partly supported by the connected by gene flow. Sorbus torminalis is distributed Conseil Régional of Poitou-Charentes. We also thank B. all over France except in the mountains and it is possible Roman-Amat and M. Vallance for their useful comments that this species functions in metapopulations. Indeed, as on the manuscript. a nomad species, S . torminalis populations can be defined as a set of subpopulations in which the individ- ual demes are subject to frequent local extinction, but REFERENCES may be replaced through colonisation [12, 18]. This defi- nition could apply well to the dynamics of the wild ser- [1] Ayers D.J., Dufty Y.S., Evidence for restricted gene vice tree. Recently there has been a considerable interest flow in a viviparous coral Seriatopara hystrix on Australia's in the genetic properties of metapopulations, particularly Great Barrier Reef, Evolution 4 (1994) 1183-1201. on the influence of the frequent extinction and colonisa- [2] Cheliak W.M., Pitel J.A., Techniques d'électrophorèse tion events on the maintenance of genetic variation and sur gel d'amidon des enzymes d'essences d'arbres forestiers, on the partitioning of this variation within and among Canadian Forest Service, Petawawa National Forest institute, local populations [8, 25, 36]. Extinction and recolonisa- Chalk river, Information Report PI-X-42F (1986). tion may produce a certain amount of genetic differentia- [3] Degen B., Scholz F., Spatial genetic differentiation tion through founder effects, if the groups that found the among populations of European beech (Fagus sylvatica L.) in new populations are sufficiently small and homogeneous western Germany as identified by geostatistical analysis, Forest [37, 41, 43]. McCauley et al. [24] have shown that a set Genetics 5 (1998) 191-199. of recently founded populations of Silene alba displays [4] Doligez A., Baril C., Joly H., Fine-scale spatial genetic considerable genetic differentiation and this structure can structure with non-uniform distribution of individuals, Genetics be ascribed to a mode of colonisation in which there is 148 (1998) 905-919. only limited mixing of individuals from different [5] Drapier N., Écologie de l'alisier torminal, S orbus sources. torminalis (L.) Crantz, Revue Forestière Française 3 (1993) 229-243. [6] Frascaria N., Santi F., Gouyon P.H., Genetic differentia- Although further investigations will be necessary to tion within and among populations of chestnut (Castanea sati- understand in more details the population genetics of va Mill.) and wild cherry (Prunus avium L.), Heredity 70 (1993) 634-641. Sorbus torminalis, the results of our investigation can [7] Gibson P.J., Wheelwright N.T., Genetic structure in already contribute to a more rationale management of the populations of a tropical tree Ocotea tenera (Lauraceae): influ- genetic resources of this scattered and valuable tree ence of avian seed dispersal, Oecologia 103 (1995) 49-54. species. Indeed, if the species does function as a [8] Gilpin M.E., The genetic effective size of metapopula- metapopulation, local extinction and colonisation are tion, Biol. J. Linn. Soc. 42 (1991) 165-175. expected in the forest. So the manager must take care to [9] Godron D.A., De l'hybridité dans le genre Sorbier, leave free areas in the forest that can be colonised by Revue des Sciences Naturelles 4 (1874) 443-447. new populations of wild service tree. This implies for [10] Hamrick J.L., Godt M.J.W., Allozyme diversity in example local absence of social tree species and a special plant species, in AHD Brown M.T., Clegg A.L., Kahler and care during the seedling development. Because gene Weir B.S. (Eds.), Plant population genetics, breeding and flow is naturally important, as evidenced from the genetic resources. Sinauer, Sunderland, Massachusetts, 1989, weakness of geographic structure at the studied scale, pp. 43-63. maintenance of conditions favouring high gene flow are [11] Hamrick J.L., Godt M.J.W., Sherman-Broyles S.L., essential; in particular, animal dispersers (insects and Factors influencing levels of genetic diversity in woody plant birds) should be preserved. The birds and especially the species, New Forests 6 (1992) 95-124. thrushes (Turdus sp.) seem to play an important role in [12] Hanski I., Gilpin M., Metapopulation dynamics - brief the homogenisation of the genetic structure over large history and conceptual domain, Biol. J. Linn. Soc. 42 (1991) distances. Indeed the fruits of wild service tree are 3-6. mature during the migration of the birds, in autumn. [13] Hartl D.L., Clark A.G., Principles of population genet- The development of maternally inherited cytoplasmic ics. 2nd ed. Sinauer Associates, Sunderland, Massachusetts markers in Sorbus torminalis will also give more infor- (1989). mation on the number and origin of founder trees, when [14] Karron J.D., A comparison of levels of genetic poly- new populations become established. morphism and self-compatibility in geographically restricted
- 71 Allozyme diversity in Sorbus torminalis and widespread plant congeners, Evolutionary Ecology 1 [32] Purdy B.G., Bayer R.J., Allozyme variation in the (1987) 47-58. Athabasca sand dune endemic, Salix silicicola, and the closely related widespread species, S. alaxensis, Systematic Botany 20 [15] Karron J.D., Linhart Y.B., Chaulk C.A., Robertson (2) (1995) 179-190. C.A., Genetic structure of populations of geographically [33] Raspé O., Jacquemart A.L., Allozyme diversity and restricted and widespread species of Astragalus (Fabaceae), genetic structure of European populations of Sorbus aucuparia, Amer. J. Bot. 75 (1988) 1114-1119. Heredity 81 (5) (1998) 537-545. [16] Kremer A., Zanetto A., Geographical structure of gene [34] Rusanen M., Mattila A., Vakkari P., Jalojen lehtipuden diversity in Quercus petraea (Matt.) Liebl. II: Multilocus pat- geneettinen monimuotoisuus-säyliytä ja käytä, Metsänt Tied. terns of variation, Heredity 78 (1997) 476-489. 605 (1996) 45-52. [17] Leonardi S., Menozzi P., Genetic variability of Fagus [35] Schirenbeck K.A., Skupski M., Lieberman D., sylvatica L. in Italy: the role of postglacial recolonization, Lieberman M., Population structure and genetic diversity in four Heredity 75 (1995) 35-44. tropical tree species in Costa Rica, Molecular Ecology 6 [18] Levins R., Extinction, Lect. Math. Life Sci. 2 (1970) (1997) 137-144. 75-107. [36] Schoen D.J., Brown A.H.D., Intraspecific variation in [19] Levin D.A., Kerster H.W., Gene flow in seed plants. population gene diversity and effective population size corre- Evol. Biol. 7 (1974) 139-220. lates with the mating system in plants, Proc. Natl. Acad. Sci. [20] Liljefors A., Cytological studies in Sorbus, Acta Horti USA 88 (1991) 4494-4497. Bergiani 17 (1955) 47-113. [37] Slatkin M., Gene flow and genetic drift in a species subject to frequent local extinction, Theor. Pop. Biol. 12 (1977) [21] Machon N., Lefranc M., Bilger I., Mazer S.J., Saar A., 253-262. Allozyme variation in Ulmus species from France: analysis of differentiation, Heredity 78 (1997) 12-20. [38] Soltis P.S., Soltis D.E., Trucker T.L., Lang F.A., Allozyme variability is absent in the narrow endemic [22] Marriette S., Lefranc M., Legrand P., Taneyhill D., Bensoniella oregona ( Saxifragaceae), Conservation Biology 6 Frascaria-Lacoste N., Machon N., Genetic variability in wild (1992) 131-134. cherry populations in France. Effects of colonizing processes, Theor. Appl. Genet. 94 (1997) 904-908. [39] Vallejos C.E., Enzyme activity staining. In: Isoenzymes in plants genetics and breeding, part. Tanksley [23] Mattila A., Vakkari P., Genetic variation of Quercus S.D., Orton T.J. (Eds.), A. Elsevier Sci Publ, Amsterdam, robur and Ulmus laevis in Finland. In Proc. Nord. Meet. For. 1983, pp. 469-516. Genet. Tree Breeders, Estonia, 1997, pp. 63-68. [40] Vicario F., Vendramin G.G., Rosi P., Liò P., Giannini, [24] Mc Cauley D.E., Raveill J., Antonovics J., Local Allozyme, chloroplast DNA and RAPD markers for determin- founding events as determinants of genetic structure in a plant ing genetic relationships between Abies alba and relic popula- metapopulation, Heredity 75 (1995) 630-636. tion of Abies nebrodensis, Theor. Appl. Genet. 90 (1995) 1012- [25] Muruyama T., Kimura M., Genetic variability and 1018. effective population size when local extinction and recoloniza- [41] Wade M.J., McCauley D.E., Extinction and recoloniza- tion of subpopulations are frequent, Proc. Natl. Acad. Sci. USA tion: their effects on the genetic differentiation of local popula- 77 (1980) 6710-6714. tions, Evolution 42 (1988), 995-1005. [26] Nei M., Analysis of gene diversity in subdivided popu- [42] Wendel J.F., Weenden N.F., Visualization and interpre- lations, Proc. Natl. Acad. Sci. USA 70 (1973) 3321-3323. tation of plant isozymes. In Isozymes in plant biology, Soltis [27] Nei M., Estimation of average heterozygosity and D.E., Soltis P.S. (Eds.), Discorides Press, Portland, 1989, genetic distance from a small number of individuals, Genetics pp. 5-45. 89 (1978) 583-590. [43] Whitlock M.C., Mc Cauley D.E., Some population [28] Pasteur N., Pasteur G., Bonhomme F., Catalan J., genetic consequences of colony formation and extinction: Britton-Davidian J., Manuel technique de génétique par élec- genetic correlations within funding groups, Evolution 44 trophorèse des protéines, Technique et Documentation (1990) 1717-1724. Lavoisier, Paris, 1987. [44] Wright S., The genetical structure of populations, Annals of Eugenics 15 (1951) 323-354. [29] Prat D., Leger C., Bojovic S., Genetic diversity among Alnus glutinosa (L.) Gaertn. Populations, Acta Oecologica 13 [45] Yagihashi T., Hayashida M., Miyamoto T., Effects of (4) (1992) 469-477. bird ingestion on seed germination of S orbus commixta , Oecologia 114 (1998) 209-212. [30] Prat D., Daniel C., Variabilité génétique de l'alisier torminal et du genre Sorbus, Rev. For. Fr. 3 (1993) 216-229. [46] Yeh F., Boyle T., PPOGENE 1.2, Microsoft window- based Software for population genetic analysis, 1997. [31] Preziosi R., Fairbairn D.J., Genetic population structure and levels of gene flow in the stream-dwelling water strider [47] Zanetto A., Kremer A., Geographical structure of gene Aquarius (Gerris) remigis (Hemiptera: Gerridae), Evolution 46 diversity in Quercus petraea (Matt.) Liebl. I. Monolocus pat- (1992) 430-444. terns of variation, Heredity 75 (1995) 506-517.
CÓ THỂ BẠN MUỐN DOWNLOAD

-
Báo cáo khoa học: "Genetic variability of the prion protein gene (PRNP) in wild ruminants from Italy and Scotland"
 6 p |
6 p |  48
|
48
|  5
5
-
Báo cáo khoa học: Intrabodies against the EVH1 domain of Wiskott–Aldrich syndrome protein inhibit T cell receptor signaling in transgenic mice T cells
14 p | 42
| 5
-

Báo cáo khoa học: Coordination of three and four Cu(I) to the a- and b-domain of vertebrate Zn-metallothionein-1, respectively, induces significant structural changes
14 p | 37
| 5
-
Báo cáo y học: "Science review: Genetic variability in the systemic inflammatory response"
7 p | 45
| 4
-
Báo cáo y học: "enetic variability and population structure of endangered Panax ginseng in the Russian Primorye"
9 p | 43
| 4
-
Báo cáo khoa hoc:" Genetic components of litter size variability in sheep"
0 p | 36
| 4
-

Báo cáo khoa học: Emerging pathways in genetic Parkinson’s disease: tangles, Lewy bodies and LRRK2
10 p | 30
| 3
-

báo cáo khoa học: "Population crash, population flush and genetic variability in cage populations of Drosophila melanogaster"
11 p | 64
| 3
-
Báo cáo khoa học: Interaction between Lim15/Dmc1 and the homologue of the large subunit of CAF-1 – a molecular link between recombination and chromatin assembly during meiosis
10 p | 44
| 2
-

Báo cáo y học: "Influence of genetic variability at the surfactant proteins A and D in community-acquired pneumonia: a prospective, observational, genetic study"
12 p | 45
| 2
-

Báo cáo khoa học: Infrared spectroscopy as a tool for discrimination between sensitive and multiresistant K562 cells
6 p | 45
| 2


Chịu trách nhiệm nội dung:
Nguyễn Công Hà - Giám đốc Công ty TNHH TÀI LIỆU TRỰC TUYẾN VI NA
LIÊN HỆ
Địa chỉ: P402, 54A Nơ Trang Long, Phường 14, Q.Bình Thạnh, TP.HCM
Hotline: 093 303 0098
Email: support@tailieu.vn
Giấy phép Mạng Xã Hội số: 670/GP-BTTTT cấp ngày 30/11/2015 Copyright © 2022-2032 TaiLieu.VN. All rights reserved.

