


Báo cáo nghiên cứu khoa học " Study on wave setup with the storm surge in Hai Phong coastal and estuarine region "
lượt xem 4
download
 Download
Vui lòng tải xuống để xem tài liệu đầy đủ
Download
Vui lòng tải xuống để xem tài liệu đầy đủ
Làn sóng thiết lập là sự gia tăng của mực nước trong khu vực lướt sóng do chuyển sóng liên quan đến động lực cột nước trong quá trình phá vỡ sóng. Làn sóng thiết lập góp phần vào chiều cao tổng lượng nước trong cơn bão và trở thành nguy hiểm để xây dựng ven biển. Nghiên cứu này trình bày một số kết quả vào thiết lập sóng dâng do bão bằng cách sử dụng mô hình số và mô hình thực nghiệm. Nó cũng ước tính sự đóng góp của làn sóng thiết lập trong tổng mức...
Bình luận(0) Đăng nhập để gửi bình luận!
Nội dung Text: Báo cáo nghiên cứu khoa học " Study on wave setup with the storm surge in Hai Phong coastal and estuarine region "
- VNU Journal of Science, Earth Sciences 26 (2010) 82-89 Study on wave setup with the storm surge in Hai Phong coastal and estuarine region Nguyen Xuan Hien* , Dinh Van Uu, Tran Thuc, Pham Van Tien Faculty of Hydro-Meteorology and Oceanography, Hanoi University of Science, VNU, 334 Nguyen Trai, Hanoi, Vietnam Received 05 September 2010; received in revised form 24 September 2010 Abstract. Wave setup is the increase of water level within the surf zone due to the transfer of wave-related momentum to the water column during wave-breaking. Wave setup contributes to the total water height in storm and become dangerous to coastal construction. This study presents some results on wave setup with storm surge using numerical model and empirical model. It also estimates the contribution of wave setup in total storm tide level at coastal and estuarine region of Hai Phong. Results show that wave setup at coastal and estuarine region in Hai Phong contributes about 25% to 40% of sea level surge in storm, 32% on average. Keywords: wave setup, storm surge, Hai Phong. 1. Introduction wave setup occurred due to horizontal change of radiation stress. The theory was highly useful A storm surge with high waves often causes in explaining the increase and decrease of sea severe damage when it coincides with high level causing by waves as well as mechanism of tides. In Viet Nam, typhoon Damrey in 2005 the surf waves in the near shore. Bowen et al. broke sea dykes and resulted in severe flooding (1968) carried out an experiment to test the by storm tide in Nam Dinh and Thanh Hoa theory and prove its reliability throughout provinces. Storm surge can several inland from simulating the wave crashed onto the shore [3]. the estuary. Waves ride above the surge levels, Moreover, there was a high correspondence causing wave runup and mean water level set- between Longuet-Higgins and Stewart’ theory up. These wave effects are significant near the and experiment data. The following studies landfall area and are affected by the process that showed that wave setup can have considerable typhoon approaches the coastline. effects on sea level in coastal zone. In the 1960s, the theory of wave setup were Recently researches on wave setup have developed by Longuet-Higgins and Stewart approached to use coupled models by (1960, 1962, 1963, 1964) [1, 2], it shows that combining hydrodynamics model of wave and _______ wave setup. The first researches have been Corresponding author. Tel.: 84-4-37730409. known as Mastenbroek et al. (1993), Zhang and E-mail: nguyenxuanhien@vkttv.edu.vn 82
- 83 N.X. Hien et al. / VNU Journal of Science, Earth Sciences 26 (2010) 82-89 was used to simulate the wave field in the Li (1997) [4, 5]. However, in these studies, investigated area. authors did not considered all the effects in breaking wave zone due to using wave model 2.2. Wave setup model for large area (WAM). Another approach, Shibaki et al. (2001) showed that, by adding The empirical wave setup of Hanslow & radiation stress to the movement equation, Nielsen (1993), Gourlay and Raubenheimer obtained results were better than in the case was used in this study. These formulas are separated run of the models to calculate wave follows: setup and storm surge. Recently, Funakoshi et - Hanslow & Nielsen (1993) al. (2008) studied wave setup by using two models, Advanced Circulation Model w 0.048 H rms 0 L0 (5) (ADCIRC) to simulate storm surge, and the SWAN to compute wave field [6]. This where w is the wave setup at the shoreline, research indicated that wave setup accounted Hrms0 is the deep water rms wave height and L0 for about between 10 and 15 percent of total sea is the deepwater wave length, which is level rise. Some other notable researches calculated by: include Hanslow and Nielsen (1993), Gourlay gTP2 L0 (6) (1992) Raubenheimer et al. (2001); the 2 experimental formulas have widely been in which T P is the pick wave period from the applied with high reliability (Happer et al., numerical wave model simulation at the 2001) [7-10]. selected output point. In Viet Nam, although some studies on storm surges have been conducted in the past, - Gourlay (1992): however approach on wave setup and the assessments of its roles in total surge are not w 0.35 H rms 0 00.4 (7) clear yet. In this study, storm wind model in which 0 is the surf similarity parameter. Boose et al. (1994) with the SWAN model are applied to simulate the wave field, and used tan 0 (8) some experimental formulas are used to H 0 / L0 calculate wave setup at some locations near Hai Phong coastal area for several storms. in which tan is the beach slope. - Raubenheimer (2001): 2. Model Description w H so (0.019 0.003 av1 ) (9) 2.1. Typhoon wind and wave model. in which Hs0 is the deepwater significant wave height, and av is the beach slope: The Boose et al. model (1994) was adopted to produce atmospheric pressure and wind hav fields of typhoons. A third-generation wave av (10) x model, SWAN (Simulating Waves Nearshore),
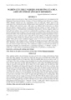
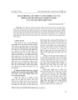
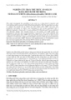
- 84 N.X. Hien et al. / VNU Journal of Science, Earth Sciences 26 (2010) 82-89 wave output point and deepwater, respectively, in which x is the width of the surf zone and given as: the average water depth: gT 1 Cg0 (13) (h )dx hav x (11) 4 where h is the still water depth, and is the 4h / L p gT p 2h 1 (14) tan Cg 1 L wave setup measured from the still water level. 2 sinh( 4h / L p ) 2 p Note that, for a planar beach, av would be In which, L p is the wavelength of the peak approximately equal to 1/2 of the beach slope. frequencies of the spectrum given as: These empirical water setup equations were gT p2 developed from field and laboratory data in 2h tan Lp (15) which moderately sized deepwater waves L 2 p impinges almost directly on the coastline. The surf zones during these conditions would vary The significant wave height in equation 5 with wave parameters but would be several and 7 is converted to an rms using: hundreds of meters wide. These formulas are 1 H rmso H s0 (16) based on an assumption of steady state 2 conditions during which wave induced currents and water level reach an equilibrium condition. The situation during severe tropical cyclones 3. Model calibration are different from conditions during which these field and laboratory data were collected. The results of calibration of the wind fields In order to obtain deepwater significant wave show that the typhoon model of Boose given a height needed for the above mentioned good simulation of wind velocity in the Hon equation, the procedure was as follows: Firstly, Dau station for the two storms [11]. Therefore, the significant wave height Hs0 at the inshore this model is used to calculate the meteorology model output point is deshoaled to the field which is input for the wave model and deepwater value to obtain: wave setup in storm. Cg 3.1. Results of wave field. H s0 Hs (12) C go Figure 1 shown the couple grid in SWAN where, C g and C g 0 are wave group speeds at model.
- 85 N.X. Hien et al. / VNU Journal of Science, Earth Sciences 26 (2010) 82-89 Figure 1. The computation mesh and domain in SWAN model. The large domain (D0) is from 105.750E to is 15 minutes. Table 1 shows the results of 108.500E and from 19.50N to 21.750N with the wave characteristics and comparison between resolution of 500m. The small domain (D1) is computed with the observation data at the Bach from 106.60E to 107.0080E and from 20.60N to Long Vi station. 20.930N with the resolution of 100m, time step
- 86 N.X. Hien et al. / VNU Journal of Science, Earth Sciences 26 (2010) 82-89 Table 1. Significant wave height Calculate Time Hs(m) Dir(0) Hs(m) Tp(s) 1.00 1.13 177 5 7h, 24/09/2005 1.00 0.83 182 5 13h, 24/09/2005 0.50 0.73 191 5 19h, 24/09/2005 0.75 0.68 200 4 7h, 25/09/2005 1.00 1.77 204 6 13h, 25/09/2005 1.00 2.48 206 7 19h, 25/09/2005 2.50 3.18 228 11 7h, 26/09/2005 3.00 4.11 232 9 13h, 26/09/2005 4.00 4.53 226 9 19h, 26/09/2005 3.00 3.20 29 8 7h, 27/09/2005 1.00 2.29 47 9 13h, 27/09/2005 0.75 1.18 53 8 19h, 27/09/2005 3.2. Results of wave-setup It is founded that the model’s results of significant wave height at the Bach Long Vi Table 2 shows the results of the wave and station are in good agriment with the observated wave-setup in typhoon Damrey (2005) by three data. Thus, the wave model has a quite good experiment at formulas of Hanslow & Nielsen, simulation for the regional wind field. Gourlay and Raubenheimer in comparison with Moreover, the significant wave height is from 1 the observations. to 2 meters in the near shore and from 3 to 5 meters in the offshore areas. Table 2. Calculated wave and wave-setup in Damrey storm (2005) Storm surge Significant wave height Wave setup (cm) Location (cm) (cm) Hanslow & Nielsen Gourlay Raubenh-eimer Lach Huyen 123 127 36,29 28,49 24,12 Nam Trieu 140 134 36,98 29,35 25,04 Lach Tray 150 134 37,23 29,67 25,38 Van Uc 144 143 37,68 30,24 26,16 The results from the three formulas show a Hien et al. (2009), and between 16 and 24 different wave setup height in typhoon percent of total surge in storm (it is supposed condition. In typhoon Damrey, maximum wave that the total surge consists of storm surge and setup was 37.68 centimeters at Van Uc in wave-setup). It is found also in other studies of Hanslow & Nielsen formula; 30.24 centimeters Tanaka and Shuto (1992), Hanslow and Nielsen in Gourlay formula and 26.16 centimeters in (1992), Tanaka et al. (2008) for other regions others. As a whole, wave setup in selected [7,12,13]. Regarding the space, the wave-setup points account for about 20 and 30 percent of in typhoon Damrey in Hai Phong distributes total of storm surge calculated by Nguyen Xuan unequaly (despite little difference only) and not
- 87 N.X. Hien et al. / VNU Journal of Science, Earth Sciences 26 (2010) 82-89 similar phase with the total storm surge. There (2008), wave-setup is different in various was a maximum of the total storm surge at the points, depending on coastal topography, depth, Lach Tray estuary, but the maximum of wave- slope [7,12,13]. In order to estimate the setup was at the Van Uc estuary, where also contribution of wave-setup to total storm surge appears the highest value of the significant at several points in the Hai Phong region, wave height. It proves that topography has a authors calculated wave-setup in several storms noticeable influence on wave height and wave- effect on Hai Phong including: Kate (1973), setup. Vera (1983), Fankie (1996), Marty (1996), Nikie (1996) and Damrey (2005). Tables from 3 to 8 show the results of wave-setup by 4. Assessment of contribution of wave-setup different methods for several points in Hai to the total storm surge in Hai Phong Phong and the results of calculating storm surge by the ADCIRC model. According to Tanaka and Shuto (1992), Hanslow and Nielsen (1992), Tanaka et al. Table 3. Typhoon Katie 1973 Storm surge Significant wave height Wave setup (cm) Location (cm) (cm) Hanslow & Nielsen Gourlay Raubenh-eimer Lach Huyen 55 116 5649 30.34 27.03 Nam Trieu 64 113 55.66 29.63 25.90 Lach Tray 49 102 52.75 27.19 23.80 Van Uc 42 116 57.14 30.91 27.02 Table 4. Typhoon Vera 1983 Storm Significant wave Wave setup (cm) Location surge (cm) height (cm) Hanslow & Nielsen Gourlay Raubenh-eimer Lach Huyen 57 94 63.38 32.26 21.17 Nam Trieu 75 103 65.19 32.65 21.47 Lach Tray 91 100 64.14 31.81 20.64 Van Uc 66 133 89.13 38.8 25.72 Table 5. Typhoon Fankie 1996 Storm surge Significant wave height Wave setup (cm) Location (cm) (cm) Hanslow & Nielsen Gourlay Raubenh-eimer Lach Huyen 85 158 51.14 34.99 27.04 Nam Trieu 98 152 50.82 34.63 26.69 Lach Tray 109 151 51.12 34.97 27.01 Van Uc 97 154 51.59 35.48 27.51
- 88 N.X. Hien et al. / VNU Journal of Science, Earth Sciences 26 (2010) 82-89 Table 6. Typhoon Marty 1996 Storm surge Significant wave height Wave setup (cm) Location (cm) (cm) Hanslow & Nielsen Gourlay Raubenh-eimer Lach Huyen 57 112 40.99 27.53 22.61 Nam Trieu 75 111 36.17 26.06 21.58 Lach Tray 91 108 34.45 25.44 20.94 Van Uc 66 124 39.42 28.04 24.80 Table 7. Typhoon Niki 1996 Storm surge Significant wave height Wave setup (cm) Location (cm) (cm) Hanslow & Nielsen Gourlay Raubenh-eimer Lach Huyen 66 142 47.06 40.38 19.94 Nam Trieu 71 148 51.39 41.47 19.65 Lach Tray 71 147 50.81 40.72 19.21 Van Uc 69 182 56.36 48.07 23.64 The computed results for the above conditions such as depth, slope and shape of mentioned typhoons are corresponded to seashore. Table 8 shows the role of wave-setup previous researches. The values of wave-setup for coastal points in Hai Phong region are different at various points in Hai Phong calculated by averaging of all storms for the region because of the difference topographic three formulas. Table 8. The contribution of the wave-setup to the total surge. Contribution (%) Location Hanslow & Nielsen Gourlay Raubenheimer Average Lach Huyen 41.19 31.70 25.36 32.75 Nam Trieu 41.13 31.60 25.10 32.61 Lach Tray 40.64 31.08 24.57 32.10 Van Uc 43.35 33.46 27.12 34.64 The results show that wave-setup has big 5. Conclusion contributed to total surge. On average, the Along with wind surge and different air wave-setup is highest at Van Uc with 34.6 pressure, wave setup is one of the important percent of total surge, but the shortest is 32.1 components in total storm tide. In the study, percent at Lach Tray. Besides, experiment wind and pressure field model, wave model and formulas give different results of wave-setup, wave setup model were applied to study in the thus, the highest value is from the formulas of Hai Phong estuarine region. The results canbe Hanslow & Nielsen and the lowest value is summarized as follows: created by the formulas of Raubenheimer. - Although in this study, model calibration was not inplemented due to lack of experiment
- 89 N.X. Hien et al. / VNU Journal of Science, Earth Sciences 26 (2010) 82-89 boundary layer. J. Phys. Oceanogr. 23 (1993) and field data, the contribution of wave setup 1856. on total water level in storms is similar to other [5] M.Y. Zhang, Y.S. Li, The dynamic coupling of a studies; third-generation wave model and a 3D hydrodynamic model through boundary-layers. - Due to complex topography in the Hai Cont. Shelf Res. 17 (1997) 1141. Phong coastal area, wave setup is different at [6] Y. Funakoshi, S.C. Hagen, P. Bacopoulos, each point. It also shows that, only small Coupling of hydrodynamic and wave models: difference can be found at each empirical case study for Hurricane Floyd (1999) Hindcast. formula. Wave setup at coastal in Hai Phong J. Waterw. Port Coast Ocean Eng, 2008. contribute about 25% and 40% of sea level [7] D. J. Hanslow, P. Nielsen, Wave setup on surge in storm, average is 32%; beaches and in river entrances, Proceedings of 23rd International Conf. on Coastal - However, the results will be more reliable Engineering, 240-252, 1992. if a large number of storms are taken into [8] M. R. Gourlay, Wave set-up, wave run-up and acount. It is necessary to combine numerical beach water table: Interaction between surf zone hydraulics and groundwater hydraulics, Coastal model with meteorology model, wave model Engineering, Volume 17, Issues 1-2, 93-144, and hydraulic model in next study 1992. [9] R. T. Raubenheimer, Guza, S. Elgar, Field observations of wave-driven setdown and setup. Acknowledgements J. Geophys. Res. 106 (2001) 4629. [10] B. A. Happer et. al. Queensland Climate Change This paper has been prepared as a part of and Coastal Vulnerability to Tropical cyclones, Project KC09.23/06-10. The authors would like Stage 3, Queensland Goverment, 400pp, 2001. to express their thanks to the support. [11] Nguyen Xuan Hien, Pham Van Tien, Duong Ngoc Tien, Dinh Van Uu, Using ADCIRC model for simulation of storm surge in coastal and estuaries of Hai Phong during References typhoon Damrey 2005. VNU Journal of Science, Natural Sciences and Technology 3S, 25 (2009) [1] Longuet-Higgins,M.S., Stewart, R.W., A note 431. onwave setup. J.Mar. Res. 21 (1963) 4. [12] H. Tanaka, N. Shuto. Field investigation at a [2] M.S. Longuet-Higgins, R.W. Stewart, Radiation mouth of small river, Proceedings of 23rd stresses in water waves; a physical discussion International Conference on Coastal with application. Deep Sea Res. 11 (1964) 529. Engineering, 1992, 2486-2499. [3] A. J. Bowen, D. L. Inman, V. P. Simmons, [13] Hitoshi Tanaka, Nguyen Xuan Tinh, Wave Wave set-down and set-up. J. Geophys. Rea. Setup at River Mouths in Japan. Journal of Vol. 73. N 8. (1968) 2569. Water Resources and Environmental [4] C. Mastenbroek, G. Burgers, P.A.E.M. Janssen, Engineering, No. 23, 2008. The dynamical coupling of a wave model and a storm surge model through the atmospheric
CÓ THỂ BẠN MUỐN DOWNLOAD

-
Báo cáo nghiên cứu khoa học: "NGHIÊN CỨU CHẤT LƯỢNG NƯỚC VÀ TÔM TỰ NHIÊN TRONG CÁC MÔ HÌNH TÔM RỪNG Ở CÀ MAU"
 12 p |
  1500
|
1500
|  120
120
-
Báo cáo nghiên cứu khoa học: "Cái tôi trữ tình trong thơ Nguyễn Quang Thiều."
10 p | 746
| 45
-
Báo cáo nghiên cứu khoa học: "NGHIÊN CỨU PHỐI TRỘN CHI TOSAN – GELATI N LÀM MÀNG BAO THỰC PHẨM BAO GÓI BẢO QUẢN PHI LÊ CÁ NGỪ ĐẠI DƯƠNG"
7 p | 659
| 45
-

Báo cáo nghiên cứu khoa học: "Giọng điệu thơ trào phúng Tú Mỡ trong “Dòng nước ngược”"
8 p | 447
| 44
-
Báo cáo nghiên cứu khoa học: "NGHIÊN CỨU THỰC NGHIỆM ẢNH HƯỞNG CỦA MƯA AXÍT LÊN TÔM SÚ (PENAEUS MONODON)"
5 p | 584
| 44
-

Báo cáo nghiên cứu khoa học: "NGHIÊN CỨU ĐẶC ĐIỂM SINH HỌC DINH DƯỠNG VÀ SINH SẢN CỦA LƯƠN ĐỒNG (Monopterus albus)"
12 p | 452
| 43
-
Báo cáo nghiên cứu khoa học: " NGHIÊN CỨU ĐẶC ĐIỂM SINH HỌC DINH DƯỠNG CÁ ĐỐI (Liza subviridis)"
6 p | 389
| 31
-
Báo cáo nghiên cứu khoa học: " NGHIÊN CỨU ĐẶC ĐIỂM SINH HỌC SINH SẢN CỦA CÁ ĐỐI (Liza subviridis)"
8 p | 348
| 29
-

Báo cáo nghiên cứu khoa học: "NGHIÊN CỨU CẢI TIẾN HỆ THỐNG NUÔI KẾT HỢP LUÂN TRÙNG (Brachionus plicatilis) VỚI BỂ NƯỚC XANH"
11 p | 519
| 29
-

Báo cáo nghiên cứu khoa học: "Vai trò của toán tử tình thái trong tác phẩm của Nguyễn Công Hoan (Qua phân tích truyện ngắn Mất cái ví)"
8 p | 398
| 24
-
Báo cáo nghiên cứu khoa học: "Quan hệ giữa cấu trúc và ngữ nghĩa câu văn trong tập truyện ngắn “Đêm tái sinh” của tác giả Trần Thuỳ Mai"
10 p | 573
| 24
-
Báo cáo nghiên cứu khoa học: " NGHIÊN CỨU TẠO KHÁNG THỂ ĐƠN DÒNG VI-RÚT GÂY BỆNH HOẠI TỬ CƠ QUAN TẠO MÁU VÀ DƯỚI VỎ (IHHNV) Ở TÔM PENAEID"
6 p | 490
| 23
-
Báo cáo nghiên cứu khoa học: "NGHIÊN CỨU ĐẶC ĐIỂM SINH HỌC CÁ KẾT (Kryptopterus bleekeri GUNTHER, 1864)"
12 p | 304
| 20
-

Báo cáo nghiên cứu khoa học: "NGHIÊN CỨU DÙNG ARTEMIA ĐỂ HẠN CHẾ SỰ PHÁT TRIỂN CỦA TIÊM MAO TRÙNG (Ciliophora) TRONG HỆ THỐNG NUÔI LUÂN TRÙNG"
10 p | 502
| 18
-
Báo cáo nghiên cứu khoa học: " NGHIÊN CỨU PHÂN VÙNG THỦY VỰC DỰA VÀO QUẦN THỂ ĐỘNG VẬT ĐÁY"
6 p | 487
| 16
-
Báo cáo nghiên cứu khoa học: " NGHIÊN CỨU THIẾT LẬP HỆ THỐNG NUÔI KẾT HỢP LUÂN TRÙNG (Brachionus plicatilis) VỚI BỂ NƯỚC XANH"
10 p | 505
| 16
-
Báo cáo nghiên cứu khoa học: " NGHIÊN CỨU THAY THẾ THỨC ĂN SELCO BẰNG MEN BÁNH MÌ TRONG NUÔI LUÂN TRÙNG (Brachionus plicatilis) THÂM CANH"
10 p | 481
| 15
-

Báo cáo nghiên cứu khoa học công nghệ: Kết quả nghiên cứu lúa lai viện cây lương thực và cây thực phẩm giai đoạn 2006 - 2010
7 p | 315
| 13


Chịu trách nhiệm nội dung:
Nguyễn Công Hà - Giám đốc Công ty TNHH TÀI LIỆU TRỰC TUYẾN VI NA
LIÊN HỆ
Địa chỉ: P402, 54A Nơ Trang Long, Phường 14, Q.Bình Thạnh, TP.HCM
Hotline: 093 303 0098
Email: support@tailieu.vn
Giấy phép Mạng Xã Hội số: 670/GP-BTTTT cấp ngày 30/11/2015 Copyright © 2022-2032 TaiLieu.VN. All rights reserved.

