


Báo cáo nghiên cứu nông nghiệp " Testing a practical artificial diet for mud crab, Scylla paramamosain, on grow-out in Mekong Delta, Vietnam "
lượt xem 5
download
 Download
Vui lòng tải xuống để xem tài liệu đầy đủ
Download
Vui lòng tải xuống để xem tài liệu đầy đủ
To obtain the best practical diet (in terms growth rate, survival rate, feed conversion ratio and water quality) which can replace the Vital feed (an expensive feed for Kuruma prawn) and trash fish under laboratory conditions. Activities 1. Conduct Experiment 1: to test three practical diets: a) the "best" diet from Vu-anh Tuan' s PhD research; b) Diet a) plus additives (e.g., vitamins and minerals); and c) Diet b) with further supplement (e.g., vitamins and minerals plus mixed enzymes). 2. Conduct Experiment 2: To compare the "best practical diet" from experiment 1, with Vital feed and trash fish (small tilapia)...
Bình luận(0) Đăng nhập để gửi bình luận!
Nội dung Text: Báo cáo nghiên cứu nông nghiệp " Testing a practical artificial diet for mud crab, Scylla paramamosain, on grow-out in Mekong Delta, Vietnam "
- VIE36 IF04 Project Number Project Title Testing a practical artificial diet for mud crab, Scylla paramamosain, on grow-out in Mekong Delta, Vietnam Research Institute for Aquaculture No. 2 Vietnamese Institution Charles Darwin University Australian Institution May 2006 December 2006 Commencement Completion Date Date Objectives To obtain the best practical diet (in terms growth rate, survival rate, feed conversion ratio and water quality) which can replace the Vital feed (an expensive feed for Kuruma prawn) and trash fish under laboratory conditions. Activities 1. Conduct Experiment 1: to test three practical diets: a) the "best" diet from Vu-anh Tuan' s PhD research; b) Diet a) plus additives (e.g., vitamins and minerals); and c) Diet b) with further supplement (e.g., vitamins and minerals plus mixed enzymes). 2. Conduct Experiment 2: To compare the "best practical diet" from experiment 1, with Vital feed and trash fish (small tilapia) Milestones Expected Date Nbr Milestone Deliverables Description CARD Contract • Research Agreement signed. Milestones and payment 1 Apr. 2006 Signed schedules in place • A summary report of all trial results, including data of 2 Research Report Dec. survival, growth rate, total bacteria and water quality, 2006 feed conversion ratio and financial analysis of feed treatments. PROJECT COMPLETION REPORT 1. Introduction Although mud crab aquaculture has been rapidly expended throughout South East Asian countries, most culture systems depended heavily on low value fish (trash fish) as feeds (Sugama 1998). In general, trash fish has been shown to be suitable for mud crab culture but there are some disadvantages. Trash fish may not always be available, particularly in the wet
- season, and there are extra costs such as electricity and a freezer necessary for storage (William & Abdullah 1999). Furthermore, utilisation of juvenile fish as trash fish, which would otherwise be consumed by the coastal local population, can impact on fisheries due to the removal of juveniles of commercially valuable species (William & FitzGerald 2002) . Some commercial mud crab feeds have been introduced to the market, but their acceptability had not been ascertained (Baliao, Dan, Santos & Muguel 1998). It has also been demonstrated that juveniles of mud crab, S. serrata, can utilise feeds formulated for Kuruma prawns (Vital and Ebi-star made in Higashimaru Company, Japan). However, the prices of Vital and Ebi- star feeds were considered too expensive (A$ 11/kg and A$6/kg respectively) to support commercial mud crab aquaculture development (Shelley 2001). Although there have been a number of studies on formulated feeds for mud crabs, there is still lacking information to develop properly a practical diet for mud crabs. In particular, there are a few evaluations of artificial diet for mud crab, Scylla paramamosain in Vietnam. To gather present studies from PhD program of Vu-anh Tuan and experience of current ACIAR nutrition project produced a range of practical diet to test at laboratory scale in this study. Spirulina is a kind of algae powder from Chuan Kuan Enterprise Co., LTD, Taiwan which isused to feed for shrimp baby This product contains approximately 60% crude protein, 6% crude fat, 9% carbohydrate, and 2% fibre. 30% of spirulina was recommended to substitute for fish spawner. It was also suggested to use as feed additive in diets for prawn and fish spawners due to it contains natural Beta-carotene source (Akiyama, Dominy & Lawrence 1992). In this study, Spirulina was substituted at rate of 4% in diet which purposed to improve mud crab growth. Calcium is an essential mineral required for skeletal structure, blood clotting, activation of enzymes, muscle contraction and cell permeability and it level relates to phosphorus (ratio of calcium:phosphorus of 1:1 to 1.5:1 in diet of shrimp (Akiyama et al. 1992). Tissue salts is a commercial product of Martin & Pleasance, VIC, Australia. Each tablet is 500 mg consisting of 0.5mcg of the Mineral Tissue Salt Calcium Phosphate (CaP) in a lactose base. In this study, CaP was used to purpose in increasing of growth of juvenile mud crabs. The objectives of this study is to evaluate formulas of practical diets (a recommended diet formula from Vu-Anh Tuan's PhD), the recommended diet and Spirulina supplementation, the recommended diet and CaP supplementation which can replace trash fish and the vital feed (expensive feed for Kuruma prawn) in term of the growth rate, survival rate, and water quality.
- 2. Materials and Methods The experiment was carried out at the Bac Lieu Experimental Research Station for Aquaculture, Nha Mat ward, Bac Lieu town, Bac Lieu province, Vietnam (belongs to the RIA 2) using juvenile mud crabs (Scylla paramamosain) (crablets) of 1g (crab 8). The crablets were produced from the same batch at hatchery. Culture system and water preparation A static water system was used for this experiment. Fifteen 500 L fibreglass tanks, containing 400 L of treated water (see below) were used in this experiment. Each tank held 14 plastic containers inside, representing one replicate. One crablet was kept in each plastic container to prevent cannibalism. Water was treated as for shrimp hatchery. At the beginning, water was settled for 3 days and 1.5 ppm KMnO4 was used to oxidise organic matter present in the water. Four days after, water was chlorinated with 30 ppm of chlorine for 3 days. After that water was neutralized with thiosulphate (20 ppm) and then filtered through a sand filter into a reservoir tank. Water was filled into trial tanks and remained at 400L each. During the course of the experiment, salinity was maintained at 24 ppt. Values of water temperature at 7:30 and 14:00 hours were 23.2±0.9 oC and 26.3± 0.7 oC respectively. Experimental diets Three practical diets were tested. The first one was the recommended diet from Vu-anh Tuan' s PhD (T1). The second diet (T2) was added with Spirulina algae powder (4%), and the third diet (T3) was substituted with 0.05% of Tissue Salt (CaP). Control diets were vital feed for kuruma prawn (T4) and marine low value trash fish (T5). The breakdown of the ingredients for the diets is listed below. Table 1 Composition of experimental diets Ingredients T1 T2 T3 T4 T5 Fishmeal 52.00 52.00 52.00 - - Soybean 13.00 13.00 13.00 - - Squid meal 5.00 5.00 5.00 - - Wheat flour 7.98 4.70 8.65 - - Flax seed oil 1.50 1.50 1.50 - - Fish oil 4.50 4.50 4.50 - - Soy lecithin 2.00 2.00 2.00 - - Cholesterol (80%) 0.20 0.20 0.20 - -
- Acetes meal 2.00 2.00 2.00 - - Fish source 0.50 0.50 0.50 - - Monosodium glutamate 0.80 0.80 0.80 - - Alginic acid 4.00 4.00 4.00 - - Vitamin mixture 2.50 2.50 2.50 - - Mineral mixture 1.00 1.00 1.00 - - Astaxanthin 10% 0.10 0.10 0.10 - - EAAs 1.20 1.20 1.20 - - Glucosamine 1.00 1.00 1.00 - - - - CaP 0.00 0.00 0.05 - - Spirulina 0.00 4.00 0.00 Vitamin C (36%) 0.70 0.70 0.70 - - Antioxidant (Bianox) 0.02500 0.02500 0.02500 - - Antifugus (Mtox) 0.25000 0.25000 0.25000 - - Vital fish - - - 100 - Marine trash fish - - - - 100 EAAs: essential amino acid mixture '-': zero CaP is from Martin & Pleasance, VIC, Australia Spirulina is from Omega Company, Taiwan Feeding The formulated feed was fed with 5 % of average body weight while the trash fish was fed 10% because of trash fish was wet. The crabs were fed twice a day at 7:00 and 17:00. Two hours from feeding, the uneaten feed was removed using siphoning. Experimental design and data collection All treatments were done in triplicates using a randomised complete design (RCD). Survival rate, growth rate, carapace width, total bacterial population, and water quality parameters: water temperature, dissolved oxygen, pH, salinity, alkalinity, biological oxygen demand (BOD), chemical oxygen demand (COD), nitrite (NO2-), phosphate (PO4-2), ammonia (NH3) were monitored. Survival rate, weight gain (%), and specific growth rate (g/day) were obtained for every 15 days. • Weight gain, specific growth rate, and feed conversion ratio were calculated according to Tacon (1990). Wf − Wi Weight gain (WG, %) = x 100 Wi
- LnWf − LnWi Specific growth rate (SGR, % day -1 ) = 100 * T Df Feed conversion ratio (FCR, g g −1 ) = WG where Wi is the initial wet weight (g), Wf is the final wet weight (g), Df is the real dry feed intake (g), Df is total feed intake (g) minus uneaten feed (g). Final number • Survival rate (%) = x 100 Initial number • The carapace width increment was estimated as below CWf − CWi Carapace width increment (CWI, %) = x 100 CWi where CWi is initial carapace width, CWf is the final carapace width, Statistical analysis The data of survival, growth rate, total bacteria, and water quality parameter were analysed using ANOVA and LSD 95% (SPSS 10 for Window, SPSS Inc., USA, 1999). 3. Results Water quality pH and dissolved oxygen Average values of pH and dissolved oxygen concentrations at 7:30 were similar between treatments. These values were presented in the Table 2. Table 2. Average values of pH and dissolved oxygen of water during 70 days Diets T1 T2 T3 T4 T5 Parameters pH 7.99±0.06 8.00±0.07 7.99±0.06 7.99±0.06 7.99±0.08 DO (mg/L) 5.03±0.16 5.02±0.17 5.03±0.17 5.04±0.15 5.06±0.15 There is no difference in pH and DO between treatments during a course of experiment (P>0.05). The stable pH values at all treatments were as a result of the same water supply source. In particular, the experiment was carried out indoor and thus there was little or no
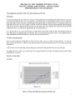
- algae growing in these tanks, resulting in a small variation in pH. Similarly, dissolved oxygen (DO) values were high and were similar at all treatments because of constant aeration. Table 3. Average values of alkalinity, phosphate (PO43-), biological oxygen demand (BOD), chemical oxygen demand (COD), ammonia (NH3), and nitrite (NO-2), and total bacteria (T- bac)(mean±SE) during 70 days of experiment PO43- Alkalinity BOD COD T- bac NO-2(ppm) Diets (ppm) NH3(ppm) (ppm) (ppm) (ppM) (cell/mL) 102.9±1.3a 0.3±0.0b 2.3±0.0a 7.3±0.6a 0.0011±0.0003a 0.2±0.0a 3474.4±606.1a T1 101.7±0.9a 0.4±0.0c 2.4±0.0b 7.6±0.4a 0.0013±0.0004a 0.2±0.0a 2560.9±752.3a T2 104.4±1.4a 0.3±0.01b 2.7±0.1cd 8.4±0.1a 0.0009±0.0001a 0.2±0.0a 2837.0±529.6a T3 93.1±1.8b 0.5±0.0d 2.5±0.1bc 6.9±0.6a 0.0011±0.0001a 0.2±0.0a 3543.0±324.3a T4 105.4±1.5a 0.2±0.0a 2.2±0.1a 6.8±0.0a 0.0007±0.0001a 0.2±0.0a 3869.4±637.6a T5 Means within the same column having a similar superscript letter are not significantly different at 5% of significance (P>0.05). Alkalinity Alkalinity content tended to decrease from the beginning to the end of experiment. At the last weeks, the alkalinity from the treatment fed with T4 (Vital feed) was significantly lower than that from other treatments (Table 3, Figure 1). The lower alkalinity content of the water in the Vital feed treatment. This could be due to Vital feed had lower Ca2+ ion than that of other diets. Phosphate In general, the Phosphate contents increased for all 1.20 treatments. Although the T4 1.00 Phosphate (mg/L) T1 treatment had low alkalinity, 0.80 T2 0.60 T3 its water had the highest T4 0.40 content of phosphate (Table 3 T5 0.20 and Figure 1 & 2). This result 0.00 could be affected from diet. 0 7 14 21 28 35 42 56 63 70 Culture period (days) The Vital feed may contain higher phosphate content Figure 2 Phosphate fluctuated during the course of than other diets. experiment
- Chemical oxygen demand and biological oxygen demand 4.00 16.00 3.50 14.00 3.00 12.00 COD (mg/L) 2.50 10.00 T1 8.00 2.00 T2 T1 BOD (mg/L) T2 6.00 T3 1.50 T3 4.00 T4 1.00 T4 T5 2.00 0.50 T5 0.00 0.00 0 7 14 21 28 35 42 56 63 70 0 7 14 21 28 35 56 63 Cultured period (days) Cultured period (days) Figure 3. Chemical oxygen demand and biological oxygen demand during of experimental period COD increased while BOD decreased during the experiment period. The values of COD and BOD was less than 14 ppm and 4 ppm, respectively). Ammonia and Nitrite 0.35 0.0080 0.0070 0.30 T1 0.0060 0.25 A m m onia (m g/L) T1 Nitr ite (m g/L) T2 0.0050 0.20 T2 T3 0.0040 T3 0.15 T4 T4 0.0030 T5 0.10 T5 0.0020 0.05 0.0010 0.00 0.0000 0 7 14 21 28 35 42 56 63 70 0 7 14 21 28 35 42 56 63 70 Culture pe riod (days) Culture period (days) Figure 4. Ammonia and nitrite concentrations during the experimental period During a course of the experiment, the contents of ammonia from all treatment were similar and very low except during a period of 7th and 14th. The values of ammonia were found from 0.004 to 0.007(mg/L). The peak of ammonia content at day 14th can be explained that after being fed, a part of feed was diluted into water while there was little bacteria population developed at the beginning of the experimental course. This caused to increase ammonia content at days 7th and 14th. After that time ammonia was transformed to nitrite as a result the ammonia content decreased while nitrite content increased sharply (Figure 4).
- With respect to nitrite, three weeks from the start of the experiment, the nitrite contents from all treatments increased rapidly to about 0.3 (mg/L). The high and stable nitrite contents were found in all treatments from the 21st days to 63rd days, except in the trash fish treatment. However, after day 63rd , all treatments were observed as the decline in nitrite content. Total bacteria The total bacterium population density in the water of all treatments was described in Figure 5. The density of bacteria increased from at the beginning and decreased at the end of experiment. The lower bacteria density at the end of the experiment was the result of the water exchange at day 60th. The variations in the mean values of bacterial population densities were not significantly different from one another (Table 3). 7000 T1 6000 T o tal b acteria (cell/mL T2 5000 T3 4000 T4 3000 T5 2000 1000 0 0 7 42 70 Culture period (days) Figure 5 Total bacteria fluctuation during the experimental period Body weight and Carapace width 12.00 45 A v e r a g e b o d y w e ig h t ( g ) 40 10.00 C a r a p a c e w id t h ( m m ) T1 T1 35 8.00 30 T2 T2 25 6.00 T3 T3 20 4.00 15 T4 T4 10 2.00 5 T5 T5 0 0.00 1 15 30 45 60 75 1 15 30 45 60 75 Culture period (days) Culture period (days)
- Figure 6 Carapace width and body weight of mud crabs during the course of experiment The average body weight and carapace width of crabs were highest in Vital feed (T4) treatment, while those of other treatments (T1, T2, T3, and T5) were similar (Table 4). Growth, survival rate, and feed consumption The highest weight gain (885.4%) and carapace width (101.85%) were detected in the crabs fed with Vital feed (T4) while these values were similar from other crabs fed T1, T2, T3, and T5 (P>0.05) (Table 4). Table 4. Weight gain (WG), carapace width increment (CWI), specific growth rate (SGR), survival rate (SUR), and feed conversion ratio (FCR) (mean ± SE) Diet WG (%) CWI (%) SGR (%/day) SUR (%) FCR a a 2.1±0.8a a 2.0±0.0b T1 383.5±61.7 68.2±6.7 88.1±2.4 a a 2.0±0.1a a 2.3±0.1cd T2 335.2±23.2 58.8±3.7 88.1±6.3 a a 2.0±0.0a a 2.3±0.1c T3 334.6±16.7 54.6±5.1 85.7±0.0 889.5±126.0b 101.9±9.2b 3.0±0.2b 100.0±0.0b 0.8±0.1a T4 a a 2.0±0.1a a 2.5±0.1d T5 362.5±36.4 62.0±4.7 83.4±4.8 Means within the same column having a similar superscript letter are not significantly different at 5% of significance (P>0.05). Similarly to the carapace width increment and weight gain, the specific growth rate (SGR) and survival rate were highest in crabs fed T4 diet while these crabs had the lowest feed conversion ratio (FCR). The crabs fed T1, T2, T3, T5 had the same SGR, SUR and FCR values. 4. Discussion The main aim of this study was to find a formulated feed that can replace trash fish and Vital feed in the rearing of juvenile mud crabs, Scylla paramamosain. It was found that trash fish can be replaced by any of the formulated feed studied here. However, Vital feed still showed the best feed available in terms of growth, survival and feed conversion ratio. This study confirms the results obtained by Tuan (2006) using smaller crablets (0.03g). Further work still needs to be done to find ways of replacing Vital feed since it is expensive (A$ 6- 11/kg) (Shelley 2001). In addition, Vital feed is formulated for shrimp and it will not be suitable for larger crabs. Supplementation of Spirulina 4% and 0.05% CaP in diets (T2, and T3 respectively) did not improve the growth, survival rate, FCR, and water quality against thediet T1. This can be explained as follow: the addition of 4% of Spirulina may upset the balance of amino acids of diet, resulting in a decrease in weight gain. It has been shown that a balance of essential amino acids of a diet is important in promoting growth of mud crabs (Tuan, 2006). The
- addition of CaP did not improve the nutritional quality of the diet. This suggests that the level of Ca in the diet was sufficient for the synthesis of the exoskeleton. However, the unbalance ratio of calcium and phosphorus may negate the effect of the added Ca. Therefore, a future study should be conducted in a range of ratio between Calcium and Phosphate in diet. For example, ratio of calcium:phosphorus of 1:1 to 1.5:1 was recommended in diet of shrimp (Akiyama et al. 1992). The different results obtained in this study may also be due to the different techniques used in the production of the pellets. The three diets T1, T2, and T3 were pelleted using a small mincer while the Vital feed was a commercial product, the pellets of were produced by a better machine. Thus, the water stability of Vital feed was better than that of T1, T2, T3. Further research should be focused in this aspect.
- References Akiyama D.M., Dominy W.G. & Lawrence A.L. (1992) Penaeid shrimp nutrition. In: Marine Shrimp Culture: Principles and Practices (ed. by A.W. Fast & L.J. Lester), pp 535- 568. Elsevier Science Publishers B.V. Baliao, Dan D., Santos D.L. & Muguel A. (1998) Grow out systems for mud crabs. International forum on the culture of Portunid Crabs, December 1-4, 1998, Boracay, Philippine, pp. 38. Shelley C. (2001) Hatchery and nursery Development of commercial production systems for mud crab (Scylla serrata) aquaculture in Australia, pp. Darwin Aquaculture centre, Department of Primary Inductry & Fisheries, NT, Australia. Sugama K., Yunus, (1998) A review of mud crab (Scylla spp.) culture and seed production in Indonesia. Interantional forum on the culture of Portunid Crabs, December 1-4, 1998, pp. 11. Boracay, Philippine. Tacon A.G.J. (1990) The essential nutrients. In: Standard method for the nutrition and feeding of farmed fish and shrimp (ed. by T. A.G.J.), pp 1-116. Argent Laboratories Press, Redmond, Washington, U.S.A. Tuan V.A. (2006) Study on development of formulated feed on grow out phase of mud crab, Scylla serrata and S. paramamosain School of Sicence and Primary Industries, pp 200. Charles Darwin University, Darwin, Australia. William C.W.S. & Abdullah M.I. (1999) Pen culture of mud crabs, genus Scylla in the Mangrove Ecosystem of Sarawak, east Malaysia. In: Mud crab aquaculture and biology. (ed. by C.P. Keenan & A. Blackhaw), pp 83-88. Australian Centre for International Agriculture. William J. & FitzGerald J. (2002) Silvofisheries: intergrated mangrove forest. In: Ecological aquaculture - The evolution and the blue revolution (ed. by A. Barry & C. Pierce), pp 161-262. Blackwell Science, USA, MA.
CÓ THỂ BẠN MUỐN DOWNLOAD

-

Báo cáo nghiên cứu nông nghiệp: Bón phân cho lúa vùng đồng bằng Sông Cửu Long - Phạm Sỹ Tân, Chu Văn Hách
 14 p |
  406
|
406
|  54
54
-

Báo cáo nghiên cứu nông nghiệp " Chuồng trại chăn nuôi dê "
51 p | 186
| 46
-

Báo cáo nghiên cứu nông nghiệp: Cây điều Việt Nam hiện trạng và giải pháp phát triển
10 p | 392
| 36
-

Báo cáo nghiên cứu nông nghiệp " Quy trình nông nghiệp an toàn GAP ... chìa khóa thành công cho rau quả tươi Việt Nam "
7 p | 148
| 26
-

Báo cáo nghiên cứu nông nghiệp " CÁC HOẠT ĐỘNG VỀ TRỒNG CỎ, CHẾ BIẾN, DỰ TRỮ THỨC ĂN CHO DÊ TRONG CÁC HỘ DỰ ÁN - PHẦN 1 "
48 p | 150
| 23
-

Báo cáo nghiên cứu nông nghiệp " SẢN XUẤT XOÀI RẢI VỤ THEO HƯỚNG GAP TẠI HUYỆN CAO LÃNH, TỈNH ĐỒNG THÁP "
11 p | 149
| 21
-

Báo cáo nghiên cứu nông nghiệp " Giới thiệu giống keo lai - quản lý, xây dựng vườn cây đầu dòng và nhân giống "
15 p | 145
| 16
-

Báo cáo nghiên cứu nông nghiệp: Nghiên cứu biện pháp quản lý tính kháng sâu hại (rầy nâu, sâu cuốn lá) một cách bền vững cho các giống lúa chất lượng cao ở đồng bằng Sông Cửu Long
5 p | 159
| 15
-

Báo cáo nghiên cứu nông nghiệp " Nghiên cứu tham dò khả năng trồng cà chua, dựa chuột dựa trên giá cụ thể trong nhà màng Polyethylene tại Lâm Đồng "
3 p | 148
| 14
-

Báo cáo nghiên cứu nông nghiệp " Lên men, sấy và đánh giá chất lượng ca cao ở Việt Nam - MS6 "
11 p | 115
| 12
-
Báo cáo nghiên cứu nông nghiệp " DỰ ÁN NUÔI THÂM CANH CÁ BIỂN TRONG AO BẰNG MƯƠNG NỔI - MS7 "
10 p | 127
| 11
-

Báo cáo nghiên cứu nông nghiệp " Xây dựng chiến lược nâng cao tính cạnh tranh của các doanh nghiệp vừa và nhỏ nông thôn trong chuỗi ngành hàng nông sản: trường hợp ngành thức ăn chăn nuôi " MS7
13 p | 123
| 9
-

Báo cáo nghiên cứu nông nghiệp " CHẨN ĐOÁN VÀ KHỐNG CHẾ BỆNH TIÊU CHẢY Ở LỢN CON TRƯỚC CAI SỮA "
18 p | 129
| 8
-
Báo cáo nghiên cứu nông nghiệp " TIẾN ĐỘ CÁC THỬ NGHIỆM LÊN MEN VÀ SẤY CHƯƠNG TRÌNH CARD 05VIE013 - THÁNG 02/2007 ĐÍNH KÈM BÁO CÁO GIAI ĐOẠN 3 "
5 p | 98
| 7
-

Báo cáo nghiên cứu nông nghiệp " CHẨN ĐOÁN VÀ KHỐNG CHẾ BỆNH TIÊU CHẢY Ở LỢN CON TRƯỚC CAI SỮA - MS4 Thiết lập và thực hành hệ thống quản lý theo dõi dữ liệu tại trang trại "
8 p | 110
| 6
-

Báo cáo nghiên cứu nông nghiệp " CHẨN ĐOÁN VÀ KHỐNG CHẾ BỆNH TIÊU CHẢY Ở LỢN CON TRƯỚC CAI SỮA - MS5: Chế tạo vacxin và kiểm tra hiệu lực của vacxin "
8 p | 113
| 6
-

Báo cáo nghiên cứu nông nghiệp " DỊCH TẢ HEO (DTH): PHÁT TRIỂN VẮC XIN DỊCH TẢ HEO MỚI - MS8 "
6 p | 142
| 6
-

Báo cáo nghiên cứu nông nghiệp " DỰ ÁN NUÔI THÂM CANH CÁ BIỂN TRONG AO BẰNG MƯƠNG NỔI - MS10 "
10 p | 105
| 5


Chịu trách nhiệm nội dung:
Nguyễn Công Hà - Giám đốc Công ty TNHH TÀI LIỆU TRỰC TUYẾN VI NA
LIÊN HỆ
Địa chỉ: P402, 54A Nơ Trang Long, Phường 14, Q.Bình Thạnh, TP.HCM
Hotline: 093 303 0098
Email: support@tailieu.vn
Giấy phép Mạng Xã Hội số: 670/GP-BTTTT cấp ngày 30/11/2015 Copyright © 2022-2032 TaiLieu.VN. All rights reserved.

