


Báo cáo y học: " A novel approach for prediction of tacrolimus blood concentration in liver transplantation patients in the intensive care unit through support vector regression"
lượt xem 6
download
 Download
Vui lòng tải xuống để xem tài liệu đầy đủ
Download
Vui lòng tải xuống để xem tài liệu đầy đủ
Tuyển tập các báo cáo nghiên cứu về y học được đăng trên tạp chí y học Critical Care giúp cho các bạn có thêm kiến thức về ngành y học đề tài: A novel approach for prediction of tacrolimus blood concentration in liver transplantation patients in the intensive care unit through support vector regression...
Bình luận(0) Đăng nhập để gửi bình luận!
Nội dung Text: Báo cáo y học: " A novel approach for prediction of tacrolimus blood concentration in liver transplantation patients in the intensive care unit through support vector regression"
- Available online http://ccforum.com/content/11/4/R83 Research Open Access Vol 11 No 4 A novel approach for prediction of tacrolimus blood concentration in liver transplantation patients in the intensive care unit through support vector regression Stijn Van Looy1*, Thierry Verplancke2*, Dominique Benoit2, Eric Hoste2, Georges Van Maele3, Filip De Turck1 and Johan Decruyenaere2 1Ghent University, Department of Information Technology (INTEC), Gaston Crommenlaan 8, Ghent, Belgium 2Ghent University Hospital, Intensive Care Department, De Pintelaan 185, Ghent, Belgium 3Ghent University, Department of Medical Statistics, De Pintelaan 185, Ghent, Belgium * Contributed equally Corresponding author: Thierry Verplancke, Thierry.Verplancke@UGent.be Received: 8 May 2007 Revisions requested: 11 Jul 2007 Revisions received: 23 Jul 2007 Accepted: 26 Jul 2007 Published: 26 Jul 2007 Critical Care 2007, 11:R83 (doi:10.1186/cc6081) This article is online at: http://ccforum.com/content/11/4/R83 © 2007 Van Looy et al.; licensee BioMed Central Ltd. This is an open access article distributed under the terms of the Creative Commons Attribution License (http://creativecommons.org/licenses/by/2.0), which permits unrestricted use, distribution, and reproduction in any medium, provided the original work is properly cited. Abstract Introduction Tacrolimus is an important immunosuppressive data values. Nonlinear RBF SVR, linear SVR, and MLR were drug for organ transplantation patients. It has a narrow performed after selection of clinically relevant input variables therapeutic range, toxic side effects, and a blood concentration and model parameters. Differences between observed and with wide intra- and interindividual variability. Hence, it is of the predicted tacrolimus blood concentrations were calculated. utmost importance to monitor tacrolimus blood concentration, Prediction accuracy of the three methods was compared after thereby ensuring clinical effect and avoiding toxic side effects. fivefold cross-validation (Friedman test and Wilcoxon signed Prediction models for tacrolimus blood concentration can rank analysis). improve clinical care by optimizing monitoring of these concentrations, especially in the initial phase after Results Linear SVR and nonlinear RBF SVR had mean absolute transplantation during intensive care unit (ICU) stay. This is the differences between observed and predicted tacrolimus blood first study in the ICU in which support vector machines, as a new concentrations of 2.31 ng/ml (standard deviation [SD] 2.47) data modeling technique, are investigated and tested in their and 2.38 ng/ml (SD 2.49), respectively. MLR had a mean prediction capabilities of tacrolimus blood concentration. Linear absolute difference of 2.73 ng/ml (SD 3.79). The difference support vector regression (SVR) and nonlinear radial basis between linear SVR and MLR was statistically significant (p < function (RBF) SVR are compared with multiple linear 0.001). RBF SVR had the advantage of requiring only 2 input regression (MLR). variables to perform this prediction in comparison to 15 and 16 variables needed by linear SVR and MLR, respectively. This is an Methods Tacrolimus blood concentrations, together with 35 indication of the superior prediction capability of nonlinear SVR. other relevant variables from 50 liver transplantation patients, were extracted from our ICU database. This resulted in a dataset Conclusion Prediction of tacrolimus blood concentration with of 457 blood samples, on average between 9 and 10 samples linear and nonlinear SVR was excellent, and accuracy was per patient, finally resulting in a database of more than 16,000 superior in comparison with an MLR model. Introduction safeguard therapeutic efficacy and to manage the risk for Purpose nephrotoxicity, other toxicities, and rejection in liver transplan- Tacrolimus blood concentrations demonstrate a wide intra- tation patients [1]. This study examines the feasibility and clin- and interindividual variability. Therefore, monitoring of these ical benefits of using a support vector regression (SVR) concentrations remains an issue of pivotal importance to algorithm in comparison with a multiple linear regression AI = artificial intelligence; ALKPHOS = alkaline phosphatise; ALT = alanine aminotransferase; ANN = artificial neural network; AST = aspartate ami- notransferase; CR = serum creatinine; GGT = gamma-glutamyl transpeptidase; Hct = hematocrit; ICU = intensive care unit; LDH = lactate dehydro- genase; MLR = multiple linear regression; RBF = radial basis function; RBF SVR = radial basis function support vector regression (nonlinear support vector regression); SD = standard deviation; SVM = support vector machine; SVR = support vector regression; UR = urea. Page 1 of 7 (page number not for citation purposes)
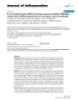
- Critical Care Vol 11 No 4 Van Looy et al. (MLR) algorithm in predicting tacrolimus blood concentration. Figure 1 Tacrolimus blood concentration is predicted starting from a selected number of clinically relevant input variables. Background Hospital information systems in intensive care medicine gener- ate large datasets on a daily basis. These rapidly increasing amounts of data make the task of extracting correct and rele- vant clinical information from intensive care unit (ICU) patients difficult [2,3]. Data modeling techniques based on machine learning such as support vector machines (SVMs) can partially reduce workload, aid clinical decision-making, and lower the frequency of human error [4]. Fundamental research in clinical data modeling forms the basis on which later validation can be The support vector algorithm heuristic In support vector machines, heuristic. classification of datapoints or prediction of an outcome parameter is performed in multicentered clinical trials. This is the first study done by finding the 'hyperplane' that separates the datapoints by trans- to use SVM for data modeling in the ICU domain. SVMs have forming the input variable dataset by a mathematical function into a been applied, however, in molecular biology [5-7], bioinformat- 'higher dimension' in which separation is much easier (feature map = ics [8], as well as in genetics [9] and proteomics [10,11]. In input variables dataset). The basis of this new heuristic is that classifi- cation of a seemingly chaotic input space is possible when one cancer research, kernel methods (or SVM) have been used to increases dimensionality and thereby finds a separating plane. Copy- predict malignancy in brain tumors [12,13] and also in staging right permission from V.P. Bioinformatics (Improved Outcomes Soft- certain forms of breast and prostate cancer [14,15]. In cardi- ware, Kingston, ON, Canada). ology, heart valve disease has been predicted with SVMs, and in fundamental cardiology research, nucleotide polymor- the application of nonlinear regression by using a kernel func- phisms of candidate genes for ischemic heart disease have tion [34] that represents the dot product of the two trans- been modeled by kernel methods [16,17]. Clinical decision- formed vectors. The MLR and the linear support vector making has been compared for prospective performance with algorithm are both linear approaches, but they differ in their logistic regression and SVM [18]. In contrast with the absence underlying theoretical heuristics: the MLR method fits a model of data concerning SVM applications in the ICU, artificial neu- using the least-mean-squares heuristic (that is, the sum of the ral networks (ANNs) – as a less recent statistical learning tech- squared distances to the regression line is minimized). The nique – have been studied thoroughly in the ICU environment: support vector algorithm fits a flat-as-possible function by they have been used for prediction of ICU mortality and prog- searching a separating hyperplane (Figure 1). The radial basis nosis in septic shock [19,20], clinical decision-making [21], function (RBF) SVR method fits a nonlinear function onto the and prediction of plasma drug concentrations [22]. Also, the data, again aiming for maximum flatness. The RBF kernel is management of infectious diseases [23], real-time analysis of also often named a Gaussian kernel since the kernel function hemodynamics [24], and research in cardiology [25,26] and is the same as the Gaussian distribution function. Smola and oncology [27,28] have benefited from recent evolutions in arti- Schölkopf [35] give an excellent overview of many details of ficial intelligence (AI) and ANN. the SVR procedure. Materials and methods Underlying theory The roots of SVM lie in the statistical learning theory [29], Data which describes properties of learning machines which enable This study received approval from the Ethics Committee of them to generalize well to unseen data. During the 1990s, Ghent University Hospital. Fifty patients who had recently SVM was developed by Vapnik and coworkers [30-32] at Bell undergone liver transplantation in Ghent University Hospital Labs (formerly AT&T Bell Laboratories, Murray Hill, NJ, USA). were included, and their medical records were reviewed. Tac- A profound overview of the underlying theory and the SVM rolimus blood concentrations, together with 35 other clinically algorithm itself is given by Guyon and Elisseeff [33]. In the relevant variables, were extracted from the ICU database. The case of SVR [29], the goal is to find a function that predicts following input variables were considered to influence tac- the target values of the training data with a deviation of at most rolimus blood concentration and were included: gender, age, ε, while requiring this function to be as flat as possible. The weight, number of transplantations, number of days after sur- core of the support vector algorithm does this for linear func- gery, existence of renal dysfunction (serum creatinine [CR] tions f(x) = + b, where (w,x) denotes the dot product of and urea [UR]) or liver dysfunction (alanine aminotransferase vectors w and x, thereby enforcing flatness by minimizing |w| [ALT], aspartate aminotransferase [AST], gamma-glutamyl (|w| denotes the Euclidian norm of vector w). By using a dual transpeptidase [GGT], total and conjugated bilirubin, alkaline representation of the minimization problem, the algorithm phosphatise [ALKPHOS], and lactate dehydrogenase [LDH] requires only dot products of the input patterns. This allows levels), hematocrit (Hct), albumin, glucose, cholesterol, and six Page 2 of 7 (page number not for citation purposes)
- Available online http://ccforum.com/content/11/4/R83 doses of tacrolimus, namely the dose at 8 a.m. and 8 p.m. from day 1, and the tacrolimus concentration on day 1. For RBF the three days (day 1, day 2, and day 3) before the day of the SVR, only two features sufficed: tacrolimus blood concentra- measured tacrolimus blood concentration (day 0). Coadminis- tion on day 1 and the evening dose of tacrolimus on day 1. To tered medications were not included. Variables cholesterol validate a specific variable selection in linear SVR and RBF and albumin were omitted due to too great a percentage of SVR, fivefold cross-validation was used. In this process, the missing data (greater than 99%) (caused by not measuring available data are split into five equally sized parts. The remain- these variables on a daily basis). The data were reorganized in der of the procedure is repeated five times. In each iteration, a patient days in which each record contained the following var- different one of the five parts is kept apart, while the remaining iables: gender, weight, age, days since transplantation, the 12 four parts are used to construct the data model. The part that previously mentioned biochemical variables measured on day was kept separate is then used to verify the data model. The 0, the same parameters on day 1, tacrolimus blood concentra- reported accuracy is the total of those measured in each of the tion on day 1, the last six tacrolimus doses given, and the tac- five iterations, thus covering the total amount of available data. rolimus blood concentration on day 0 as a prediction target. This resulted in a total amount of 35 input variables and 1 out- Variable selection for the MLR model put variable. Records in which the output parameter was miss- In the MLR model also, the variable selection was performed ing were removed from the data. Patient days in which less with a forward, a backward, and a stepwise algorithm for sim- than four of the six previous doses were available were also left ple linear regression in SPSS 12.0 and regression coefficients out. This resulted in 457 records originating from 50 patients were checked for significance. The significance level was set at α = 0.05. Adjusted R2 values and goodness of fit were com- and a total of more than 16,000 data values. In these 457 records, 77% were complete, 15% contained a single missing pared for the different MLR variable selections in SPSS. After value, and the remaining 7% had a maximum of 3 (of 35) val- selection of the final variable set for MLR, these variables were ues missing. This resulted in a total of 147/15,995 (0.92%) tested for correlation and multicollinearity. Variance inflation missing values. This extremely low number of missing values factor and eigenvalues were determined. For MLR, 16 varia- was filled in by means of an expectation maximization method bles were retained: gender, weight, age, Hct, LDH, UR, ALK- [36]. PHOS, GGT, CR (all on day 0), AST on day 1, ALT on day 1, morning and evening doses of tacrolimus on day 1, evening Data analysis dose of tacrolimus on day 2, and the morning dose of tac- Data analysis for the linear SVR and the RBF SVR model was rolimus on day 3. Gender, weight, and age were included performed using software implemented by the authors based because of their clinical relevancy. After linear regression of on the libSVM 2.82 [37] software package. Analysis for the this final variable set, normality testing of the residues as well MLR model was performed in SPSS 12.0 (SPSS Inc., Chi- as heteroscedasticity testing were performed. After searching cago, IL, USA). A mean absolute difference with the measured the lambda value for the maximum likelihood with the Box-Cox tacrolimus blood concentration of maximum 3 ng/ml and a algorithm, a transformation of the dependent variable (tac- standard deviation (SD) of maximum 5 ng/ml was agreed upon rolimus blood concentration) in the MLR model was performed to be acceptable by expert opinion. because of heteroscedasticity of the residuals. To validate the final regression model, fivefold cross-validation was used, as in the SVR model. Variable selection for the linear SVR and the RBF SVR model This phase in the SVR model building is analogous with the Parameter selection for the linear SVR and the RBF SVR variable selection phase for the MLR model. Using all 35 vari- model ables to construct a data model would result in suboptimal Parameter selection denotes the process of setting data accuracy because different variables may contain overlapping model parameters. These are the parameters that tune a data information that disturbs the model-constructing process. modeling technique. The MLR method has no such parame- ters. The linear SVR method has two such parameters: ε and Therefore, for each method (linear SVR, RBF SVR, and MLR), variable selection out of this total of 35 variables was done C. Epsilon controls the flatness of the resulting data model, using recursive addition, recursive removal, stepwise addition, whereas C controls the cost of a prediction error: setting C to and stepwise removal of the input variables. These selection high values will result in fewer prediction errors in the training procedures are inspired by the commonly used stepwise data. The RBF SVR method has three model parameters: the already discussed ε and C and the extra kernel function param- regression technique in MLR, first presented by Effroymson eter γ, which determines the degree of nonlinearity: setting γ to [38]. The four selection procedures often result in different var- iable subsets. The best-performing subset was selected. In lin- high values results in a highly nonlinear data model [39]. The ear SVR, 15 features were selected: weight, age, days since model parameters can be set using theoretical considerations transplantation, Hct, UR, ALKPHOS, ALT, total bilirubin, GGT that may assume certain properties of the data. The data, how- (all on day 0), LDH on day 1, UR on day 1, morning doses of ever, are not always perfect: it may contain noise and nonre- tacrolimus on day 2 and day 3, evening dose of tacrolimus on moved trends. Parameter values obtained in this way are thus Page 3 of 7 (page number not for citation purposes)
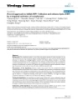
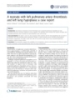
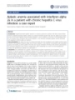
- Critical Care Vol 11 No 4 Van Looy et al. suboptimal. Therefore, in this study, the parameters are set tions for the three methods between the measured and the using theoretical heuristics after which this initial setting is predicted blood concentrations: 0.762, 0.753, and 0.742 for fine-tuned using pattern search [40]. To validate a specific linear SVR, RBF SVR, and MLR, respectively. Mean absolute parameter selection in linear SVR and RBF SVR, again fivefold difference between measured and predicted blood concentra- cross-validation was used. tions was smallest when using linear SVR: this difference between linear SVR and MLR was statistically significant (p < Statistical analysis 0.001). Also, when mean signed differences were analyzed, Statistical analysis was carried out with SPSS 12.0. Results the same significantly better results were observed in linear SVR in comparison with MLR. Even after post hoc analyses (α/ are reported as percentages, means, minimums and maxi- mums, ranges, and SDs (as appropriate). A fivefold cross-val- 3 for multiple testing, thus significance when p < 0.017), the idation algorithm was applied for validation of the prediction significant difference between linear SVR and MLR remained results. The correlation between measured and predicted tac- valid. A Bland-Altman plot (Figure 6) outlines the difference rolimus blood concentrations was analyzed with a Spearman between linear SVR and MLR. rank correlation coefficient. Differences between linear SVR, Discussion RBF SVR, and MLR were analyzed with the Friedman test and Wilcoxon signed rank test. A Bonferroni adjustment was per- Linear SVR for prediction of tacrolimus blood concentration formed for multiple testing. A Bland-Altman plot was used to resulted in a lower mean absolute error in comparison with the illustrate significant differences between the three compared MLR model (Table 1). Incorporating nonlinearity in the predic- methods. Absolute difference as well as signed difference tor, however, by using a nonlinear kernel function, resulted in a were studied. Mean absolute difference is the absolute differ- prediction accuracy that was slightly less than in linear SVR, ence between predicted and measured values, without its but this prediction still outweighed the accuracy of the MLR sign, and is an indication of the magnitude of the error, model. It is remarkable that this result was obtained using whereas mean signed difference indicates whether a model much fewer variables: only 2 input variables were used instead tends to predict higher or lower values than the measured of 15 and 16 variables by the linear methods. Apparently, value. The significance level was set at α = 0.05. these 2 input variables contained more information in a nonlin- ear way than the other 15 or 16 contained in a linear way. Results When a linear method (linear SVR or MLR) was examined with Of the total study population, 58% (29/50) were male, mean only the 2 input variables used by the nonlinear RBF SVR age was 54 years (range 22 to 70), and mean weight was 79 model, the obtained prediction accuracy was lower than when kg. Table 1 gives a summary of the mean absolute differences using the nonlinear RBF SVR method. However, the added between measured and predicted tacrolimus concentrations prediction strength of the extra 13 or 14 input variables in the for the three models. In the distribution of the prediction errors linear SVR and MLR methods, respectively, is rather small. The made by the three methods, it has to be noted that the MLR nonlinear RBF SVR method is able to extract this extra infor- model has the largest number of outliers (Figure 2). Figures 3 mation from only 2 input variables. to 5 demonstrate the correlation between the observed tac- rolimus blood concentration and the predicted blood concen- It is worth noting that in each of the three prediction models, tration for linear SVR (Figure 3), RBF SVR (Figure 4), and MLR the tacrolimus blood concentration on day 1 is incorporated, (Figure 5). These findings were corroborated by the Spearman along with other variables. Obviously, the tacrolimus concen- rank correlation coefficients, which indicated good correla- tration on day 1 on its own already contains a lot of information Table 1 Predicted tacrolimus blood concentration and mean absolute difference between real and predicted tacrolimus blood concentrations Mean (ng/ml) Standard deviation (ng/ml) Minimum (ng/ml) Maximum (ng/ml) Predicted level linear SVR 10.4 4.2 1.6 34.0 Mean absolute difference 2.31 2.47 0.0 19.6 Predicted level RBF SVR 10.4 4.2 1.4 35.3 Mean absolute difference 2.38 2.49 0.0 19.4 Predicted level MLR 10.8 5.5 3.0 63.7 Mean absolute difference 2.73 3.79 0.0 54.4 MLR, multiple linear regression; RBF SVR, radial basis function support vector regression (nonlinear support vector regression); SVR, support vector regression. Page 4 of 7 (page number not for citation purposes)
- Available online http://ccforum.com/content/11/4/R83 Figure 2 Figure 4 the radial basis function support tacrolimus blood model Correlation of real and predicted vector regression concentrations for the radial basis function support vector regression model. Figure 5 three models Outliers for the prediction of the tacrolimus blood concentration for the three models. MLR, multiple linear regression; RBF SVR, radial basis function support vector regression (nonlinear support vector regres- sion); SVR, support vector regression. *'s represent extreme values (values more extreme than 3*IQR). Figure 3 the multiple linear and predicted tacrolimus blood concentrations for Correlation of real regression model the multiple linear regression model. indicating that adding the last evening dose of tacrolimus improves performance drastically. Moreover, it should be mentioned that in the linear kernel model a moderate amount of collinearity between the input variables was present (UR on 2 consecutive days, tacrolimus dose on 2 consecutive days) and that collinearity was not present between the two input variables of the RBF SVR model. In the MLR model, there was the linear support and predicted tacrolimus Correlation of real vector regression model blood concentrations for no problem of multicollinearity after the variable selection the linear support vector regression model. phase. It will be very interesting to see whether the results of about the level to be predicted. To verify the added value of this SVR model will be corroborated by similar results after incorporating this extra variable (tacrolimus dose on day 1), an testing this new technology on large multicentered ICU data- RBF SVR model using only the previous tacrolimus blood con- bases in future research. centration was constructed and evaluated using fivefold cross-validation. This model yielded a mean absolute error of This is the first report in which tacrolimus concentration is 3.23 ng/ml (SD 3.12) and a maximum error of 26.33 ng/ml, modeled by SVR, but a few other studies have already Page 5 of 7 (page number not for citation purposes)
- Critical Care Vol 11 No 4 Van Looy et al. Conclusion Figure 6 Results demonstrate a statistically significant superiority of lin- ear SVR in comparison with MLR as well as a trend toward superiority of nonlinear SVR in comparison with MLR for the prediction of tacrolimus blood concentration in post-liver transplantation patients during ICU stay. The accuracies were all within clinically acceptable ranges. Moreover, nonlinear SVR required only two variables to make the tacrolimus blood concentration predictions. SVM technology has promising possibilities as a clinical decision agent in the ICU environment. Competing interests The authors declare that they have no competing interests. Authors' contributions JD and FDT were responsible for the study concept, design, and overall responsibility. TV performed data acquisition and contributed to the statistical analysis and the drafting of the manuscript. SVL performed data transformation, wrote part of the SVM algorithm, and contributed to the drafting of the man- uscript. DB and GVM contributed to the statistical analysis. All authors were responsible for the interpretation of data. All (a + b)/2 (linear SVR and MLR) linear regression (MLR) linear SVR difference (SVR) (a) and multiple = a - b; y-axis linear support vector and MLR Bland-Altman plot for comparison of = mean of(b): x-axis =regression= authors, including EH, contributed to the final manuscript. (SVR) (a) and multiple linear regression (MLR) (b): x-axis = difference Funding for this study arose in part from project funding by an (linear SVR and MLR) = a - b; y-axis = mean of linear SVR and MLR = (a + b)/2. If two models are the same, all datapoints are represented FWO scholarship and in part from clinical funding by the around one point. However, in this figure, there is a considerable Ghent University Hospital. SVL and TV contributed equally to amount of spread between the datapoints of the linear SVR method this article. and the MLR method which is a graphical illustration of the statistical difference found between these two methods. Acknowledgements performed prediction of tacrolimus concentration using other The authors thank Tom Fiers and Chris Danneels for their technical sup- port in the data acquisition process. AI techniques. Chen and colleagues [22] reported the use of a neural network and a genetic algorithm to predict the tac- References rolimus blood concentration. This neural network algorithm 1. Kershner RP, Fitzsimmons WE: Relationship of FK506 whole resulted in an average difference of the observed and pre- blood concentrations and efficacy and toxicity after liver and dicted tacrolimus concentrations of 1.74 ng/ml with a range kidney transplantation. Transplantation 1996, 62:920-926. 2. Decruyenaere J, De Turck F, Vanhastel S, Vandermeulen F, from 0.08 to 5.26 ng/ml. Bayesian forecasting as well has Demeester P, de Moor G: On the design of a generic and scal- been applied in modeling tacrolimus concentrations. Fukudo able multilayer software architecture for data flow manage- ment in the intensive care unit. Methods Inf Med 2003, and colleagues [41] demonstrated that Bayesian prediction of 42:79-88. tacrolimus concentrations on the basis of previously acquired 3. De Turck F, Decruyenaere J, Thysebaert P, Van Hoecke S, Volck- population-based pharmacokinetic data in adult patients aert B, Danneels C, Colpaert K, De Moor G: Design of a flexible platform for execution of medical decision support agents in receiving living-donor liver transplantation was possible within the intensive care unit. Comput Biol Med 2007, 37:97-112. a certain timeframe after liver transplantation. However, a 4. Colpaert K, Claus B, Somers A, Vandewoude K, Robays H, Decru- study by Willis and colleagues [42], using a population phar- yenaere J: Impact of computerized physician order entry on medication prescription errors in the intensive care unit: a con- macokinetic model based on Bayesian forecasting and trolled cross-sectional trial. Crit Care 2006, 10:R21. adapted for individual pharmacokinetic, demographic, and 5. Guan CP, Jiang ZR, Zhou YH: Predicting the coupling specificity of GPCRs to G-proteins by support vector machines. Genom- covariate data, resulted in predictions that were too imprecise. ics Proteomics Bioinformatics 2005, 3:247-251. In future research, the SVR-based model will be adapted to 6. Yang ZR: Biological applications of support vector machines. predict the tacrolimus dose to be given to ICU patients to Brief Bioinform 2004, 5:328-338. 7. Wang YF, Chen H, Zhou YH: Prediction and classification of obtain a predefined window of tacrolimus concentrations. human G-protein coupled receptors based on support vector Afterward, a randomized controlled trial will compare the accu- machines. Genomics Proteomics Bioinformatics 2005, racy of intensivists versus this SVR model in daily clinical 3:242-246. 8. Byvatov E, Schneider G: Support vector machine applications practice. in bioinformatics. Appl Bioinformatics 2003, 2:67-77. 9. Vinayagam A, König R, Moormann J, Schubert F, Eils R, Glatting KH, Suhai S: Applying Support Vector Machines for Gene Page 6 of 7 (page number not for citation purposes)
- Available online http://ccforum.com/content/11/4/R83 Ontology based gene function prediction. BMC Bioinformatics ter Science, Proceedings of the 1996 International Conference 2004, 5:116. on Artificial Neural Networks Volume 1112. London, UK: 10. Yang ZR, Chou KC: Bio-support vector machines for computa- Springer-Verlag; 1996:47-52. tional proteomics. Bioinformatics 2004, 20:735-741. 33. Guyon I, Elisseeff A: An introduction to variable and feature 11. Li L, Tang H, Wu Z, Gong J, Gruidl M, Zou J, Tockman M, Clark RA: selection. J Machine Learning Res 2003, 3:1157-1182. Data mining techniques for cancer detection using serum pro- 34. Aizerman MA, Braverman EM, Rozonoer LI: Theoretical founda- teomic profiling. Artif Intell Med 2004, 32:71-83. tions of the potential function method in pattern recognition 12. Li GZ, Yang J, Ye CZ, Geng DY: Degree prediction of malig- learning. Automation Remote Control 1964, 25:821-837. nancy in brain glioma using support vector machines. Comput 35. Smola AJ, Schölkopf B: A tutorial on support vector regression. Biol Med 2006, 36:313-325. In NeuroCOLT Technical Report NC-TR-98-030 London, UK: 13. Glotsos D, Tohka J, Ravazoula P, Cavouras D, Nikiforidis G: Auto- Royal Holloway College, University of London, UK; 1998. mated diagnosis of brain tumours astrocytomas using proba- 36. Dempster AP, Laird NM, Rubin DB: Maximum likelihood from bilistic neural network clustering and support vector incomplete data via the EM algorithm. J Royal Stat Soc Ser B machines. Int J Neural Syst 2005, 15:1-11. 1977, B 39:1-38. 14. Mattfeldt T, Trijic D, Gottfried HW, Kestler HA: Classification of 37. Chang CC, Lin CJ: LIBSVM: a library for support vector incidental carcinoma of the prostate using learning vector machines. 2001 [http://www.csie.ntu.edu.tw/~cjlin/libsvm]. quantization and support vector machines. Cell Oncol 2004, 38. Effroymson MA: Multiple regression analysis. In Mathematical 26:45-55. Methods for Digital Computers Edited by: Ralston A, Wilf HS. 15. Papadopoulos A, Fotiadis DI, Likas A: Characterization of clus- New York, NY: Wiley; 1960:191-203. tered microcalcifications in digitized mammograms using 39. Lin CJ, Keerthi S: Asymptotic behaviors of support vector neural networks and support vector machines. Artif Intell Med machines with Gaussian kernel. Neural Comput 2003, 2005, 34:141-150. 15:1667-1689. Comak E, Arslan A, Türkoğlu I: A decision support system based 16. 40. Dennis JE, Torczon V: Derivative-free pattern search methods on support vector machines for diagnosis of the heart valve for multidisciplinary design problems. In Proceedings of the 5th diseases. Comput Biol Med 2007, 37:21-27. AIAA/USAF/NASA/ISSMO Symposium on Multidisciplinary 17. Yoon Y, Song J, Hong SH, Kim JQ: Analysis of multiple single Analysis and Optimization American Institute of Aeronautics and nucleotide polymorphisms of candidate genes related to cor- Astronautics, Reston, VA; 1994:922-932. onary heart disease susceptibility by using support vector 41. Fukudo M, Yano I, Fukatsu S, Saito H, Uemoto S, Kiuchi T, Tanaka machines. Clin Chem Lab Med 2003, 41:529-534. K, Inui K: Forecasting of blood tacrolimus concentrations 18. Pochet NL, Suykens JA: Support vector machines versus logis- based on the Bayesian method in adult patients receiving liv- tic regression: improving prospective performance in clinical ing-donor liver transplantation. Clin Pharmacokinet 2003, decision-making. Ultrasound Obstet Gynecol 2006, 42:1161-1178. 27:607-608. 42. Willis C, Staatz CE, Tett SE: Bayesian forecasting and predic- 19. Clermont G, Angus DC, DiRusso SM, Griffin M, Linde-Zwirble WT: tion of tacrolimus concentrations in pediatric liver and adult Predicting hospital mortality for patients in the intensive care renal transplant recipients. Ther Drug Monit 2003, 25:158-166. unit: a comparison of artificial neural networks with logistic regression models. Crit Care Med 2001, 29:291-296. 20. Wong LS, Young JD: A comparison of ICU mortality prediction using the APACHE II scoring system and artificial neural networks. Anaesthesia 1999, 54:1048-1054. 21. Frize M, Ennett CM, Stevenson M, Trigg HC: Clinical decision support systems for intensive care units: using artificial neural networks. Med Eng Phys 2001, 23:217-225. 22. Chen HY, Chen TC, Min DI, Fischer GW, Wu YM: Prediction of tacrolimus blood levels by using the neural network with genetic algorithm in liver transplantation patients. Ther Drug Monit 1999, 21:50-56. 23. Lucas PJ, de Bruijn NC, Schurink K, Hoepelman A: A probabilistic and decision-theoretic approach to the management of infec- tious disease at the ICU. Artif Intell Med 2000, 19:251-279. 24. Goldman JM, Cordova MJ: Advanced clinical monitoring: con- siderations for real-time hemodynamic diagnostics. Proc Annu Symp Comput Appl Med Care 1994:752-755. 25. Spencer RG, Lessard CS, Davila F, Etter B: Self-organising dis- covery, recognition and prediction of haemodynamic patterns in the intensive care unit. Med Biol Eng Comput 1997, 35:117-123. 26. Parmanto B, Deneault LG, Denault AY: Detection of hemody- namic changes in clinical monitoring by time-delay neural networks. Int J Med Inform 2001, 63:91-99. 27. Lisboa PJ, Taktak AF: The use of artificial neural networks in decision support in cancer: a systematic review. Neural Netw 2006, 19:408-415. 28. Lisboa PJ, Wong H, Harris P, Swindell R: A Bayesian neural net- work approach for modelling censored data with an applica- tion to prognosis after surgery for breast cancer. Artif Intell Med 2003, 28:1-25. 29. Vapnik VN: The Nature of Statistical Learning Theory Berlin, Ger- many: Springer-Verlag; 1995. 30. Boser BE, Guyon IM, Vapnik VN: A training algorithm for optimal margin classifiers. In Proceedings of the Fifth Annual Workshop on Computational Learning Theory Pittsburgh, PA: ACM Press; 1992:144-152. 31. Cortes C, Vapnik V: Support-vector networks. Machine Learning 1995, 20:273-297. 32. Schölkopf B, Burges CJC, Vapnik V: Incorporating invariances in support vector learning machines. In Lecture Notes In Compu- Page 7 of 7 (page number not for citation purposes)
CÓ THỂ BẠN MUỐN DOWNLOAD

-
Báo cáo y học: " Neurogenic diabetes insipidus presenting in a patient with subacute liver failure: a case report"
 5 p |
5 p |  67
|
67
|  7
7
-
Báo cáo khoa học: " A novel approach to inhibit HIV-1 infection and enhance lysis of HIV by a targeted activator of complement"
4 p | 87
| 6
-
Báo cáo y học: " A neonate with left pulmonary artery thrombosis and left lung hypoplasia: a case report"
5 p | 57
| 5
-
Báo cáo y học: " Aplastic anemia associated with interferon alpha 2a in a patient with chronic hepatitis C virus infection: a case report"
5 p | 78
| 5
-
Báo cáo y học: " Fractured metallic tracheostomy tube in a child: a case report and review of the literature"
4 p | 66
| 4
-
Báo cáo y học: " Four small supernumerary marker chromosomes derived from chromosomes 6, 8, 11 and 12 in a patient with minimal clinical abnormalities: a case report"
4 p | 70
| 4
-
Báo cáo y học: "Conservative management of a grade V injury to an ectopic pelvic kidney following blunt trauma to the lower abdomen: a case report"
3 p | 71
| 4
-
Báo cáo y học: "A novel hybrid aspirin-NO-releasing compound inhibits TNFalpha release from LPS-activated human monocytes and macrophages"
10 p | 58
| 4
-
Báo cáo y học: " Parotid fistula secondary to suppurative parotitis in a 13-year-old girl: a case report"
4 p | 54
| 4
-
Báo cáo y học: " Mycotic aneurysm of the inferior gluteal artery caused by non-typhi Salmonella in a man infected with HIV: a case report."
4 p | 92
| 4
-
Báo cáo y học: "Cyclosporine-A therapy-induced multiple bilateral breast and accessory axillary breast fibroadenomas: a case report"
3 p | 60
| 4
-
Báo cáo y học: " Use of near-infrared light to reduce symptoms associated with restless legs syndrome in a woman: a case report"
5 p | 71
| 3
-
Báo cáo y học: " Effect of continuous positive airway pressure therapy on a large hemangioma complicated with obstructive sleep apnea syndrome: a case report"
4 p | 66
| 3
-
Báo cáo y học: " Supportive treatment using a compression garment vest of painful sternal instability following deep surgical wound infection: a case report"
3 p | 68
| 3
-
Báo cáo y học: "Cardiac tamponade mimicking tuberculous pericarditis as the initial presentation of chronic lymphocytic leukemia in a 58-year-old woman: a case report"
4 p | 62
| 3
-
Báo cáo y học: "High-grade endometrial stromal sarcoma presenting in a 28-year-old woman during pregnancy: a case report"
4 p | 65
| 3
-
Báo cáo y học: " Arsenic trioxide, a potent inhibitor of NF-κB, abrogates allergen-induced airway hyperresponsiveness and inflammation"
12 p | 104
| 3
-
Báo cáo y học: " Vgf is a novel biomarker associated with muscle weakness in amyotrophic lateral sclerosis (ALS), with a potential role in disease pathogenesis"
8 p | 107
| 3


Chịu trách nhiệm nội dung:
Nguyễn Công Hà - Giám đốc Công ty TNHH TÀI LIỆU TRỰC TUYẾN VI NA
LIÊN HỆ
Địa chỉ: P402, 54A Nơ Trang Long, Phường 14, Q.Bình Thạnh, TP.HCM
Hotline: 093 303 0098
Email: support@tailieu.vn
Giấy phép Mạng Xã Hội số: 670/GP-BTTTT cấp ngày 30/11/2015 Copyright © 2022-2032 TaiLieu.VN. All rights reserved.

