


Báo cáo y học: " Changes in microRNA expression profiles in HIV-1-transfected human cells"
lượt xem 4
download
 Download
Vui lòng tải xuống để xem tài liệu đầy đủ
Download
Vui lòng tải xuống để xem tài liệu đầy đủ
Tuyển tập các báo cáo nghiên cứu về y học được đăng trên tạp chí y học quốc tế cung cấp cho các bạn kiến thức về ngành y đề tài: Changes in microRNA expression profiles in HIV-1-transfected human cells
Bình luận(0) Đăng nhập để gửi bình luận!
Nội dung Text: Báo cáo y học: " Changes in microRNA expression profiles in HIV-1-transfected human cells"
- Retrovirology BioMed Central Open Access Short report Changes in microRNA expression profiles in HIV-1-transfected human cells Man Lung Yeung1, Yamina Bennasser1, Timothy G Myers2, Guojian Jiang2, Monsef Benkirane3 and Kuan-Teh Jeang*1,4 Address: 1Molecular Virology Section, Laboratory of Molecular Microbiology National Institute of Allergy and Infectious Diseases, National Institutes of Health Bethesda, Maryland 20892-0460, USA, 2Microarray Research Facility, Research Technologies Branch, National Institute of Allergy and Infectious Diseases, National Institutes of Health Bethesda, Maryland 20892-8005, USA, 3Laboratoire de Virologie Moleculaire, Institut de Genetique Humaine, CNRS UPR1142, Montpellier, France and 4Building 4, Room 306, 9000 Rockville Pike, Bethesda, MD 20892- 0460, USA Email: Man Lung Yeung - yeungm@niaid.nih.gov; Yamina Bennasser - ybennasser@niaid.nih.gov; Timothy G Myers - tmyers@niaid.nih.gov; Guojian Jiang - GJiang@niaid.nih.gov; Monsef Benkirane - Monsef.BenKirane@igh.cnrs.fr; Kuan-Teh Jeang* - kj7e@nih.gov * Corresponding author Published: 28 December 2005 Received: 14 December 2005 Accepted: 28 December 2005 Retrovirology 2005, 2:81 doi:10.1186/1742-4690-2-81 This article is available from: http://www.retrovirology.com/content/2/1/81 © 2005 Yeung et al; licensee BioMed Central Ltd. This is an Open Access article distributed under the terms of the Creative Commons Attribution License (http://creativecommons.org/licenses/by/2.0), which permits unrestricted use, distribution, and reproduction in any medium, provided the original work is properly cited. Abstract MicroRNAs (miRNAs) are small RNAs of 18–25 nucleotides (nt) in length that play important roles in regulating a variety of biological processes. Recent studies suggest that cellular miRNAs may serve to control the replication of viruses in cells. If such is the case, viruses might be expected to evolve the ability to modulate the expression of cellular miRNAs. To ask if expression of HIV-1 genes changes the miRNA profiles in human cells, we employed a high throughput microarray method, termed the RNA-primed Array-based Klenow Enzyme (RAKE) assay. Here, we describe the optimization of this assay to quantify the expression of miRNAs in HIV-1 transfected human cells. We report distinct differences in miRNA profiles in mock-transfected HeLa cells versus HeLa cells transfected with an infectious HIV-1 molecular clone, pNL4-3. complementarity, one miRNA can target multiply differ- Findings MicroRNAs (miRNAs) are small RNAs of 18–25 nucle- ent mRNAs [20]. It is conceivable that viruses may seek to otides (nt) in length that are involved in the regulation of alter cellular miRNA expression in ways that benefit viral a variety of biological processes including developmental replication. Extant findings support such a notion since timing, signal transduction, apoptosis, cell proliferation several viruses have been found to encode RNAi suppres- and tumorigenesis [1-3]. Recent studies indicate that cel- sors which could function to influence the cell's overall lular miRNAs can variably inhibit [4] or promote [5] viral miRNA milieu [6-12]. replication. Viruses, on the other hand, seem to have developed strategies which include virus-encoded RNAi For HIV-1, it has been proposed, based on in vitro assays, suppressors [6-12] and/or virus-encoded miRNAs [13- that Tat can partially repress the processing activity of 19]. Mechanistically, a current view is that miRNAs func- Dicer [21]. Because Dicer is involved in the maturation of tion to silence gene expression through imperfect base- cellular miRNAs, we wondered how miRNA profiles in pairing with cognate transcripts. Since RNA silencing human cells that express HIV-1 proteins might differ from mediated by miRNA does not require perfect sequence counterpart cells that do not express viral genes. To ask if Page 1 of 8 (page number not for citation purposes)
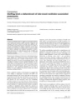
- Retrovirology 2005, 2:81 http://www.retrovirology.com/content/2/1/81 Figure 1 Schematic diagram of the RAKE assay Schematic diagram of the RAKE assay. A) The DNA oligonucleotide probe for miRNA detection is composed of three elements. The 5' linker region contains a constant nucleotide sequence (5'GTCGTGACTGGGAATAGCCTG3') with an amine-modified 5'end which permits the probe to conjugate efficiently to the epoxy-coated microarray glass slide. The anti- miRNA region contains a sequence complementary to specific miRNA (for instance, anti-hsa-let-7a 5'AACTATACAACCTACTACCTCA3') for capturing the cognate miRNA (hsa-let-7a 5'UGAGGUAGUAGGUUGUAUAGUU3'). The poly-thymidine region acts as a template for primer extension of the hybrid- ized miRNA using biotinylated-dATP. B) Small RNAs isolated from cells are hybridized to the microarray slide described in A. After washing, unhybridized single-stranded DNA probes (ssDNA probes) are removed by exonuclease I. Digested nucleotides are then removed leaving the hybridized miRNAs for primer extension. The poly-thymidine region now acts as a template for the hybridized miRNA to be extended using Klenow (3'→5' exo-) in the presence of biotinylated-dATP. Streptavidin-Alexa fluor 555 is then used to bind the biotin group permitting the fluorescent detection of hybridized miRNAs using a GenePix 4000B microarray scanner (Axon/Molecular Dynamics). HIV-1 alters the expression of host miRNAs, we employed miRNAs in the samples being tested. This contrasts with a high throughput microarray approach to quantify some conventional microarray methods which use RNA changes in miRNA expression. We used a platform based ligase to add linkers on both ends of transcripts for subse- on the RNA-primed Array-based Klenow Enzyme (RAKE) quent sample amplification. The enzyme kinetics of RNA assay. RAKE originally described by Nelson and col- ligase varies depending on substrate sequences; thus, leagues is a microarray assay which uses on-slide enzy- amplified samples may inaccurately represent that in the matic reactions and primer extension [22]. We printed original starting population [24,25]. Moreover, complete specific DNA oligonucleotide probes which contain three sequence complementarity of the 3'end of miRNA with distinct elements onto a microarray glass slide (Fig 1A). the DNA oligonucleotide probe used in RAKE is abso- The three different elements include a 5' linker containing lutely required for the primer extension step. Since many a constant nucleotide sequence with amine-modified mature miRNAs differ from their precursor forms and 5'end for effective slide conjugation; a 3' anti-miRNA ele- their paralogs in the 3'end sequence, this property offers a ment of variable sequence which is complementary to specificity advantage to RAKE over several other microar- specific miRNA; and a poly-thymidine region which ray methodologies. allows for primer extension and labeling of hybridized miRNAs (Fig 1B). It is important to note that RAKE does To validate and optimize our RAKE analysis, we first not employ a sample amplification step; and the enzymes printed, based on the published miRNA literature, a small (Klenow and exonuclease I) used in this assay work in an number of DNA probes on glass slides. Our initial sam- unbiased, substrate sequence-independent way [23]. pling set was designed to distinguish between miRNAs Thus, RAKE-signals faithfully reflect the true amount of reported to be expression-specific for Jurkat versus HeLa Page 2 of 8 (page number not for citation purposes)
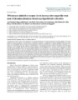
- Retrovirology 2005, 2:81 http://www.retrovirology.com/content/2/1/81 Figure 2 Verification of the specificity and sensitivity of RAKE Verification of the specificity and sensitivity of RAKE. A) (a) A prototype small microarray designed to detect a limited number of miRNAs was first used to monitor the specificity of miRNA expression in HeLa and Jurkat cells. For purposes of verifying internal reproducibility of hybridization, each probe on the microarray slide was printed 4 times (spots 1, 2, 3 and 4 labeled at top of each column). The identity of individual probe is labeled next to the slide. Red left-hand filled circle indicates the miRNA expected to be expressed in HeLa cells. Red right-hand filled circle indicates the miRNA expected to be expressed in Jurkat cells. Red fully-filled circle indicates the miRNA expected to be present in both HeLa and Jurkat cells. Unfilled circle indicates the miRNA not expected to appear in either HeLa or Jurkat cells. Orange fully-filled circle represents "spike-in" oligos included act as positive controls to monitor successful hybridization performance. (b) We hybridized small RNAs isolated from HeLa (Left panel) and Jurkat cells (right panel) using microarray slides described in (a). Signals appear as green dots (fluores- cence at 532 nm). With the exception of hsa-miR-142-3p in Jurkat cells, cell-specific signals were observed in the microarray hybridizations in patterns consistent with that expected for HeLa and Jurkat cells. 10-5 M of "spike-in" oligo (ath-miR-157a) was included in the experiment as an indicator of the maximum saturating signal from RAKE (saturated signals appear in white dots). Data are presented here in raw form without further modification or normalization. B) We demonstrated the specificity of RAKE by hybridizing small RNA isolated from Jurkat cells to a subset of polymorphic miRNA (hsa-let-7 family). The names, sequences of the miRNAs and the raw signals detected from the RAKE assay are listed. hsa-let-7c and hsa-let-7f differ from hsa-let-7a in one nucleotide base (highlighted in yellow). However, the signals detected for hsa-let-7a are approximately 16 times less than that detected for hsa-let-7c and hsa-let-7f, suggesting that RAKE can distinguish a single base difference. Simi- larly, the signals detected for hsa-let-7c are approximately 2.5 times higher than that detected in hsa-let-7b which has only one nucleotide difference (highlighted in yellow). C) To estimate the sensitivity of the RAKE assay, different concentrations of "spike-in" oligo (ath-miR-157a) were hybridized to the small microarray described in (a). The raw data from the four different hybridization reactions (each measuring four replicated spots) are presented on the X-axis at the indicated concentrations of "spike-in" target oligo. Signal intensity of each spot (median pixel) was measured and converted into log2 scale. A linear range of detection can be observed when the log2 values are plotted against the concentration of the "spike-in" oligos between 10-8 to 10-6 M. An approximate minimum detectable concentration in this RAKE assay is 10-7 M. Error bars represent the standard deviation of the values from the four replicated spottings of each probe. Page 3 of 8 (page number not for citation purposes)
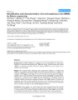
- Retrovirology 2005, 2:81 http://www.retrovirology.com/content/2/1/81 Figure Changes3in miRNA profile after transfection of HeLa cells with HIV-1 pNL4-3 Changes in miRNA profile after transfection of HeLa cells with HIV-1 pNL4-3. A) Example slide readouts are shown using small RNAs isolated from mock-(left panel) and pNL4-3-transfected HeLa cells (right panel). Here, each probe was printed 5 times in a row (spots 1, 2, 3, 4 and 5 labeled at top of the arrays). Signals appear as green dots. B) Cell plot analysis of the miRNA expression profiles of mock-transfected HeLa cells (samples 1 and 2) and pNL4-3-transfected HeLa cells (sample 3). Each colored block represents the expression of one miRNA (labeled on the left) in the indicated sample. Signals acquired from the microarray are converted into color (high signal = red; low signal = black; no signal = green). Samples 1 and 2 (mock- transfected HeLa cells) show highly similar color patterns while sample 3 (pNL4-3-transfected HeLa cells) shows reduced miRNA expression (i.e. only a few blocks appear red in color). The red-boxed miRNAs were chosen for real-time PCR valida- tion in figure 5. cells [22] (Fig 2Aa). We wanted to verify that if we hybrid- from experiment to experiment. We also chose a subset of ized our slides with miRNAs isolated from HeLa cells, polymorphic miRNA (hsa-let-7 family) in order to verify then only HeLa-specific signals would appear in our RAKE the specificity of hybridization detected by our RAKE. assay. Similarly, we wanted to validate the converse for Using small RNAs isolated from Jurkat cells for hybridiza- Jurkat miRNAs. When we performed the assays, we indeed tion, RAKE was able to distinguish a single nucleotide dif- replicated the expected cell-specific miRNA expression ference (hsa-let-7a from hsa-let-7c and hsa-let-7f; hsa-let- patterns, with a single exception for hsa-miR-142-3p. Hsa- 7c from hsa-let-7b), suggesting the conditions used by us miR-142-3p was reported by others to be expressed in Jur- are highly stringent (Fig 2B). kat cells, but was not detected by us in those cells (Fig 2Ab). It is unclear why hsa-mirR-142-3p was not detected The sensitivity of RAKE was evaluated by hybridizing in our assay, but a trivial explanation might be because microarray slides with varying amounts of ath-miR-157a. there are many different lines of Jurkat cells used in vari- As shown in Fig 2C, RAKE provided robust signals when challenged with as low as 10-7 M of substrate, and offered ous laboratories. We note that our routinely included linear readouts in log2 scale for substrates in the 10-8 to 10- "spike-in" oligo (ath-miR-157a), used as a control for the 6 M range. We defined our signal as the median of fore- success of the enzymatic reaction, behaved reproducibly Page 4 of 8 (page number not for citation purposes)
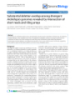
- Retrovirology 2005, 2:81 http://www.retrovirology.com/content/2/1/81 Scatterplot analysis of the changes in miRNA expression after transfection of HeLa cells with HIV-1 clone pNL4-3 Figure 4 Scatterplot analysis of the changes in miRNA expression after transfection of HeLa cells with HIV-1 clone pNL4-3. Pairwise comparison of two mock-transfected HeLa cells (sample 1 vs. sample 2) to each other and to pNL4-3-trans- fected HeLa cells (sample 3) by scatterplot analysis. Spots associated with individual miRNAs were collected and converted into log2 scale. Each datum point represents one unique probe sequence (based on median values from 4 replicated spots from each hybridization). miRNAs with similar signal intensities from the two samples being compared line up together on a 45° diagonal line (center line). This is most clearly seen in (A), where two mock-transfected HeLa cells samples are compared to each other. In this comparison, most of the dots line up together at the center line supporting that the miRNA expression pat- terns of the two samples (1 and 2) are highly similar. By contrast, miRNAs with expression levels higher or lower in one sam- ple than the other sample are expected to produce dots that deviate from the center line. The dots are allocated to positions that are above or below than the +2 fold or -2 fold line when the differences are greater than two folds. This was the case when the log2 values of sample 3 (pNL4-3-transfected HeLa cells) was plotted against sample 1 (B) or 2 (C). The miRNAs with reduced expression in sample 3 are allocated to positions below the -2 fold line. The red-circled miRNAs were chosen for real-time PCR validation as shown in figure 5. Page 5 of 8 (page number not for citation purposes)
- Retrovirology 2005, 2:81 http://www.retrovirology.com/content/2/1/81 Figure 5 Validation of RAKE using real-time PCR Validation of RAKE using real-time PCR. Fluorescence signals from each of the 45 PCR cycles were collected and con- verted into log10 values. The log10 fluorescence values (Y-axis) of each sample are then plotted against the PCR cycles (X-axis) to generate a sigmoid curve. CT (threshold-cycle; dotted line) determines the minimum PCR cycle required for the reaction to give a threshold fluorescence signal. Samples with more templates require fewer PCR cycles to reach the threshold. Compari- son of the miRNA expression levels in pNL4-3- (green curve) and mock-transfected HeLa cells (red curve) are facilitated by using cellular small nuclear U6 RNA (blue curve from mock, and orange curve from pNL4-3; please note that the blue and orange control curves superimpose closely on top of each other, supporting the validity of the PCR conditions for comparing the experimental curves) and an empirically established unchanged miRNA (mi-526c; mock and pNL4-3 samples are shown in red and in green curves, respectively) as normalization references (A). Selected pNL4-3-downregulated miRNAs [miR-93 (B), miR-148b (C), miR-221 (D) and miR-16 (E)] were validated by real-time PCR. Real-time PCR curves for U6 RNA control (mock and pNL4-3) are included in all of the graphs for normalization. Signals of the selected miRNAs measured in the RAKE assay from different samples (1, 2 and 3) are presented in table form at the top of each graph. Page 6 of 8 (page number not for citation purposes)
- Retrovirology 2005, 2:81 http://www.retrovirology.com/content/2/1/81 ground spot fluorescence at 532 nm wavelength minus Competing interests background (defined by surrounding pixel intensity); The author(s) declare that they have no competing inter- negative values were reset as zero. ests. After optimization of conditions in initial small scale Acknowledgements tests, we next printed microarray slides which contained We thank members of the Jeang laboratory and two outside colleagues for their critical reviews of the manuscript. We also thank Dr. Mourelatos for 312 individual probes based on published sequences of the discussion of RAKE assay technique. all-known mature human miRNAs at time of slide pro- duction. We separately hybridized individual slides with References small RNAs (20 µg per slide) isolated from mock-trans- 1. Yeung ML, Bennasser Y, LE SY, Jeang KT: siRNA, miRNA and HIV: fected HeLa or HeLa cells transfected with infectious HIV- promises and challenges. Cell Res 2005, 15:935-946. 1 molecular clone, pNL4-3 (see Fig 3A for actual examples 2. Kim VN: Small RNAs: classification, biogenesis, and function. Mol Cells 2005, 19:1-15. of typical results). The results from cell plot analysis of 3. Croce CM, Calin GA: miRNAs, cancer, and stem cell division. repeated hybridizations indicated that large numbers of Cell 2005, 122:6-7. 4. Lecellier CH, Dunoyer P, Arar K, Lehmann-Che J, Eyquem S, Himber miRNAs in pNL4-3-transfected HeLa cells, when com- C, Saib A, Voinnet O: A cellular microRNA mediates antiviral pared to mock-transfected HeLa cells, were significantly defense in human cells. Science 2005, 308:557-560. downregulated (Fig 3B). Clear differences were revealed in 5. Jopling CL, Yi M, Lancaster AM, Lemon SM, Sarnow P: Modulation of hepatitis C virus RNA abundance by a liver-specific Micro- comparisons of mock-transfected HeLa cells to pNL4-3- RNA. Science 2005, 309:1577-1581. transfected HeLa cells using scatterplot analysis (Fig 4). 6. Voinnet O: Induction and suppression of RNA silencing: insights from viral infections. Nat Rev Genet 2005, 6:206-220. Although many miRNAs were reduced in expression in 7. Voinnet O, Pinto YM, Baulcombe DC: Suppression of gene silenc- the HeLa-pNL4-3 sample (e.g. ~43% of all of the miRNAs ing: a general strategy used by diverse DNA and RNA viruses were more than two-fold downregulated), the majority of of plants. Proc Natl Acad Sci U S A 1999, 96:14147-14152. 8. Roth BM, Pruss GJ, Vance VB: Plant viral suppressors of RNA miRNAs remained unchanged, suggesting that the silencing. Virus Res 2004, 102:97-108. observed results are not due to non-specific generalized 9. Qu F, Morris TJ: Suppressors of RNA silencing encoded by cellular toxicity. Interestingly, in our assays, miRNAs plant viruses and their role in viral infections. FEBS Lett 2005, 579:5958-5964. upregulated by transfected pNL4-3 were exceedingly rare. 10. Ye K, Malinina L, Patel DJ: Recognition of small interfering RNA Pending further understanding of mechanisms, it is con- by a viral suppressor of RNA silencing. Nature 2003, 426:874-878. ceivable that the downregulation of mature miRNAs as 11. Lakatos L, Szittya G, Silhavy D, Burgyan J: Molecular mechanism of detected by our RAKE assay may be due to the Dicer-sup- RNA silencing suppression mediated by p19 protein of tom- pressive effect exerted by HIV-1 Tat protein and/or TAR busviruses. EMBO J 2004, 23:876-884. 12. Kasschau KD, Xie Z, Allen E, Llave C, Chapman EJ, Krizan KA, Car- RNA [21,26]. rington JC: P1/HC-Pro, a viral suppressor of RNA silencing, interferes with Arabidopsis development and miRNA unc- tion. Dev Cell 2003, 4:205-217. To confirm our RAKE assays, we tested selected results 13. Bennasser Y, Le SY, Yeung ML, Jeang KT: HIV-1 encoded candi- using real time PCR as described by Shi and Chiang [27]. date micro-RNAs and their cellular targets. Retrovirology 2004, Using these assays, we checked the RAKE results in HeLa 1:43. 14. Pfeffer S, Sewer A, Lagos-Quintana M, Sheridan R, Sander C, Grasser cells for four HIV-1 downregulated miRNAs (miR-93, FA, van Dyk LF, Ho CK, Shuman S, Chien M, Russo JJ, Ju J, Randall G, miR-148b, miR-221 and miR-16) (Fig 5B, C, D and 5E). Lindenbach BD, Rice CM, Simon V, Ho DD, Zavolan M, Tuschl T: We used two normalization controls, a miRNA (miR- Identification of microRNAs of the herpesvirus family. Nat Methods 2005, 2:269-276. 526c) whose expression was found empirically to be 15. Pfeffer S, Zavolan M, Grasser FA, Chien M, Russo JJ, Ju J, John B, reproducibly unchanged in our assays, and a miRNA- Enright AJ, Marks D, Sander C, Tuschl T: Identification of virus- encoded microRNAs. Science 2004, 304:734-736. unrelated small cellular RNA, the small nuclear U6 RNA 16. Grey F, Antoniewicz A, Allen E, Saugstad J, McShea A, Carrington JC, (Fig 5A). Real time PCR results confirmed the findings Nelson J: Identification and characterization of human from RAKE. cytomegalovirus-encoded microRNAs. J Virol 2005, 79:12095-12099. 17. Sullivan CS, Grundhoff AT, Tevethia S, Pipas JM, Ganem D: SV40- In conclusion, we describe here a rapid assay that moni- encoded microRNAs regulate viral gene expression and tors reproducible changes in cells transfected with HIV-1 reduce susceptibility to cytotoxic T cells. Nature 2005, 435:682-686. infectious molecular clone, pNL4-3. We find that a domi- 18. Omoto S, Ito M, Tsutsumi Y, Ichikawa Y, Okuyama H, Brisibe EA, Sak- nant pattern of response in HeLa cells to pNL4-3 transfec- sena NK, Fujii YR: HIV-1 nef suppression by virally encoded microRNA. Retrovirology 2004, 1:44. tion is the downregulated expression of many miRNAs. 19. Omoto S, Fujii YR: Regulation of human immunodeficiency Studies are ongoing to examine changes in miRNA expres- virus 1 transcription by nef microRNA. J Gen Virol 2005, sion patterns in human cells (primary and T cell lines) 86:751-755. 20. Lim LP, Lau NC, Garrett-Engele P, Grimson A, Schelter JM, Castle J, after infection with HIV-1. Bartel DP, Linsley PS, Johnson JM: Microarray analysis shows that some microRNAs downregulate large numbers of target mRNAs. Nature 2005, 433:769-773. Page 7 of 8 (page number not for citation purposes)
- Retrovirology 2005, 2:81 http://www.retrovirology.com/content/2/1/81 21. Bennasser Y, Le SY, Benkirane M, Jeang KT: Evidence that HIV-1 encodes an siRNA and a suppressor of RNA silencing. Immu- nity 2005, 22:607-619. 22. Nelson PT, Baldwin DA, Scearce LM, Oberholtzer JC, Tobias JW, Mourelatos Z: Microarray-based, high-throughput gene expression profiling of microRNAs. Nat Methods 2004, 1:155-161. 23. Brody RS, Doherty KG, Zimmerman PD: Processivity and kinetics of the reaction of exonuclease I from Escherichia coli with polydeoxyribonucleotides. J Biol Chem 1986, 261:7136-7143. 24. Ohtsuka E, Nishikawa S, Fukumoto R, Tanaka S, Markham AF: Join- ing of synthetic ribotrinucleotides with defined sequences catalyzed by T4 RNA ligase. Eur J Biochem 1977, 81:285-291. 25. Romaniuk E, McLaughlin LW, Neilson T, Romaniuk PJ: The effect of acceptor oligoribonucleotide sequence on the T4 RNA ligase reaction. Eur J Biochem 1982, 125:639-643. 26. Gatignol A, Laine S, Clerzius G: Dual role of TRBP in HIV repli- cation and RNA interference: viral diversion of a cellular pathway or evasion from antiviral immunity? Retrovirology 2005, 2:65. 27. Shi R, Chiang VL: Facile means for quantifying microRNA expression by real-time PCR. Biotechniques 2005, 39:519-525. Publish with Bio Med Central and every scientist can read your work free of charge "BioMed Central will be the most significant development for disseminating the results of biomedical researc h in our lifetime." Sir Paul Nurse, Cancer Research UK Your research papers will be: available free of charge to the entire biomedical community peer reviewed and published immediately upon acceptance cited in PubMed and archived on PubMed Central yours — you keep the copyright BioMedcentral Submit your manuscript here: http://www.biomedcentral.com/info/publishing_adv.asp Page 8 of 8 (page number not for citation purposes)
CÓ THỂ BẠN MUỐN DOWNLOAD

-
Báo cáo y học: "MRI bone oedema scores are higher in the arthritis mutilans form of psoriatic arthritis and correlate with high radiographic scores for joint damage"
 9 p |
9 p |  122
|
122
|  7
7
-
Báo cáo y học: " Interactions among type I and type II interferon, tumor necrosis factor, and -estradiol in the regulation of immune response-related gene expressions in systemic lupus erythematosus"
10 p | 88
| 5
-
Báo cáo y học: " Implication of granulocyte-macrophage colony-stimulating factor induced neutrophil gelatinase-associated lipocalin in pathogenesis of rheumatoid arthritis revealed by proteome analysis"
12 p | 109
| 5
-
Báo cáo y học: "Reduced levels of two modifiers of epigenetic gene silencing, Dnmt3a and Trim28, cause increased phenotypic nois"
10 p | 73
| 4
-
Báo cáo y học: "Introduction of medical emergency teams in Australia and New Zealand: a multicentre study"
2 p | 113
| 4
-
Báo cáo y học: "Effect of bladder volume on measured intravesical pressure:"
6 p | 109
| 4
-

Báo cáo y học: " Influence of the cystic fibrosis transmembrane conductance regulator on expression of lipid metabolism-related genes in dendritic cells"
15 p | 85
| 4
-

Báo cáo y học: " Arsenic trioxide, a potent inhibitor of NF-κB, abrogates allergen-induced airway hyperresponsiveness and inflammation"
12 p | 95
| 3
-
Báo cáo y học: ": Immunostaining of modified histones defines high-level features of the human metaphase epigenome"
14 p | 81
| 3
-
Báo cáo y học: "Rapid chromosome territory relocation by nuclear motor activity in response to serum removal in primary human fibroblasts"
0 p | 94
| 3
-
Báo cáo y học: " GE Rotterdam, the Netherlands. †Department of Human Genetics"
18 p | 68
| 3
-
Báo cáo y học: "The electronic version of this article is the complete one and can be found online"
6 p | 88
| 3
-
Báo cáo y học: "ontinuity, psychosocial correlates, and outcome of problematic substance use from adolescence to young adulthood in a community sample"
1 p | 79
| 3
-
Báo cáo y học: " Vgf is a novel biomarker associated with muscle weakness in amyotrophic lateral sclerosis (ALS), with a potential role in disease pathogenesis"
8 p | 95
| 3
-
Báo cáo y học: "Staffing level: a determinant of late-onset ventilator-associated pneumonia"
3 p | 106
| 3
-
Báo cáo y học: "TPO, but not soluble-IL-6 receptor, levels increase after anagrelide treatment of thrombocythemia in chronic myeloproliferative disorders"
5 p | 83
| 3
-
Báo cáo y học: "hese authors contributed equally to this work"
0 p | 84
| 2
-
Báo cáo y học: "Substantial deletion overlap among divergent Arabidopsis genomes revealed by intersection of short reads and tiling arrays"
0 p | 81
| 2


Chịu trách nhiệm nội dung:
Nguyễn Công Hà - Giám đốc Công ty TNHH TÀI LIỆU TRỰC TUYẾN VI NA
LIÊN HỆ
Địa chỉ: P402, 54A Nơ Trang Long, Phường 14, Q.Bình Thạnh, TP.HCM
Hotline: 093 303 0098
Email: support@tailieu.vn
Giấy phép Mạng Xã Hội số: 670/GP-BTTTT cấp ngày 30/11/2015 Copyright © 2022-2032 TaiLieu.VN. All rights reserved.

