


Final examination semester 2 academic year 2019-2020 course name: Mathematical statistics for engineers - ĐH Sư phạm Kỹ thuật
lượt xem 2
download
 Download
Vui lòng tải xuống để xem tài liệu đầy đủ
Download
Vui lòng tải xuống để xem tài liệu đầy đủ
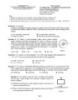
Final examination semester 2 academic year 2019-2020 course name: Mathematical statistics for engineers giúp các bạn sinh viên có thêm tài liệu để củng cố các kiến thức, ôn tập kiểm tra, thi cuối kỳ. Đây là tài liệu bổ ích để các em ôn luyện và kiểm tra kiến thức tốt, chuẩn bị cho kì thi học kì. Mời các em và các quý thầy cô giáo bộ môn tham khảo.
Bình luận(0) Đăng nhập để gửi bình luận!
CÓ THỂ BẠN MUỐN DOWNLOAD


Chịu trách nhiệm nội dung:
Nguyễn Công Hà - Giám đốc Công ty TNHH TÀI LIỆU TRỰC TUYẾN VI NA
LIÊN HỆ
Địa chỉ: P402, 54A Nơ Trang Long, Phường 14, Q.Bình Thạnh, TP.HCM
Hotline: 093 303 0098
Email: support@tailieu.vn
Giấy phép Mạng Xã Hội số: 670/GP-BTTTT cấp ngày 30/11/2015 Copyright © 2022-2032 TaiLieu.VN. All rights reserved.

