


Hội thảo khoa học Quốc tế: Khởi nghiệp và sáng tạo - Cơ hội và thách thức đối với doanh nghiệp Việt Nam (Tập 1)
lượt xem 8
download
 Download
Vui lòng tải xuống để xem tài liệu đầy đủ
Download
Vui lòng tải xuống để xem tài liệu đầy đủ
Cuốn sách "Hội thảo khoa học Quốc tế: Khởi nghiệp và sáng tạo - Cơ hội và thách thức đối với doanh nghiệp Việt Nam (Tập 1)" cung cấp cho bạn đọc những bài viết về chủ đề: cơ chế và chính sách cho hoạt động khởi nghiệp, đổi mới sáng tạo; thực tiễn khởi nghiệp, sáng tạo của các quốc gia trên thế giới; các giải pháp cải cách thủ tục hành chính cho khởi nghiệp sáng tạo của các doanh nghiệp; cơ chế vốn, tài chính cho khởi nghiệp sáng tạo;... Mời các bạn cùng tham khảo!
Bình luận(0) Đăng nhập để gửi bình luận!
Nội dung Text: Hội thảo khoa học Quốc tế: Khởi nghiệp và sáng tạo - Cơ hội và thách thức đối với doanh nghiệp Việt Nam (Tập 1)
- HỘI THẢO KHOA HỌC QUỐC TẾ INTERNATIONAL CONFERENCE KHỞI NGHIỆP VÀ SÁNG TẠO CƠ HỘI VÀ THÁCH THỨC ĐỐI VỚI DOANH NGHIỆP VIỆT NAM ENTREPRENEURSHIP AND CREATIVITY OPPORTUNITIES AND CHALLENGES FOR VIETNAM’S ENTERPRISES TẬP 1 NHÀ XUẤT BẢN HÀ NỘI Tháng 9 - 2019 1
- 2
- CHỦ ĐỀ TOPIC 3
- 4
- INTRA INDUSTRY TRADE IN MANUFACTURES BETWEEN VIETNAM AND ASEAN THƯƠNG MẠI NỘI NGÀNH TRONG NGÀNH CHẾ TẠO GIỮA VIỆT NAM VÀ CÁC NƯỚC ASEAN Phan Thanh Hoan, PhD College of Economics, Hue University Abstract: This paper is aimed to empirically investigate the patterns and development of intra-industry trade (IIT) in manufactures between Vietnam and the members of The Association of Southeast Asian Nations (ASEAN) in the period of 2007-2016. The widely used Grubel-Lloyd Index is employed to calculate the levels of IIT, then distinguished into vertical and horizontal IIT of Vietnam-ASEAN manufacturing trade for the study period. Next, the developments of Vietnam-ASEAN IIT are discussed. The results show that the IIT of Vietnam-ASEAN manufactures is dominated by horizontal IIT. The paper also suggests some policy implications for the development of IIT between the two parties. Keywords: Intra-industry trade, manufactures, development, Vietnam, ASEAN JEL Classification: F14, C2 Tóm tắt Nghiên cứu này nhằm phân tích mô hình và sự phát triển của thương mại nội ngành (IIT) trong ngành chế tạo giữa Việt Nam và các thành viên của Hiệp hội các quốc gia Đông Nam Á (ASEAN) giai đoạn 2007-2016. Chỉ số IIT của Grubel-Lloyd được dùng để tính toán IIT, IIT theo chiều dọc và chiều ngang của ngành chế tạo giữa Việt Nam và ASEAN. Tiếp đó là phân tích về mô hình và sự phát triển của IIT giữa Việt Nam và ASEAN. Kết quả cho thấy IIT trong ngành chế tạo giữa Việt Nam và ASEAN chủ yếu là IIT theo chiều ngang. Từ đó nghiên cứu đề xuất một số hàm ý chính sách cho sự phát triển IIT giữa hai bên. Từ khóa: Thương mại nội ngành, chế tạo, phát triển, Việt Nam, ASEAN 1. Introduction Trade relations between Vietnam and ASEAN have expanded significantly over the past decades. Total export turnover between Vietnam and ASEAN countries has increased seven-fold in the 20 years since Vietnam became a member of the bloc. ASEAN has continually been an important trading partner of Vietnam and the bilateral trade relationship has been growing. Total export turnover stood at $41.49 billion in the 20-year period, accounting for 11.8 per cent of Vietnam’s total trade. ASEAN was the largest trading partner of Vietnam in 1996 and 20 years later is the fourth largest partner, after the US, the EU, and China (General Department of Vietnam Customs, 2017). 5
- There has been a significant increase in trade of manufactured products between Vietnam and ASEAN since 2000s. According to our calculation, the manufactured products constitute over 80% of Vietnam’s exports to, compared to about 65% of imports from ASEAN. This is owing to the increasing economic scale of the two and the industrialization progress of ASEAN’s members. The literature of international trade studies shows the great attention of many researchers on the intra-industry trade (IIT), which is defined as the simultaneous exports and imports of a product within a particular industry, in world trade. The first attempt of intra-industry trade study was conducted by Grubel and Lloyd (1975), by which the most popular index for measurement of intra-industry trade was developed. Over time, there have been many other economists contributed to this area. However, most previous studies (e.g, Cheong and Bang, 2008; Hastiadi, 2012; Chemsripong et al., 2005; Umemoto, 2005) have focused on the total IIT without distinguishing between its components, the Horizontal intra-industry trade (HIIT) and Vertical intra-industry trade (VIIT). Furthermore, only a few studies (e.g. Das, Gouranga G., 2003; Jambol, A.B., & Ismail, N.W., 2013; Kumar, Sushil, 2014) analyze the characteristics and pattern of IIT. For ASEAN intra-industry trade, there has been little study in this region, especially at the industry level, (see, Julia Wiklander, 2008; AK Jha, S Saha, 2011; Sujinda Chemsripong, 2012; Tan, Day-Yin and Chin, Mui-Yin, 2017). Moreover, few studies examined the Vietnamese case, including manufactured trade flows. Thus, in order to complement these limitations, this study will classify and discuss the development of manufactured trade between Vietnam and ASEAN, divide IIT into HIIT and VIIT in order to examine the development of IIT’s components. The purpose of this study is to access the pattern and trend of IIT of Vietnam’s manufacturing trade with ASEAN. First, the well-known and widely used Grubel-Lloyd Index is employed to calculate the levels of total, vertical and horizontal intra-industry trade of Vietnam-ASEAN manufacturing trade for the 2007-2016 period, then the developments of Vietnam-ASEAN IIT are discussed. This paper is organized as follows. Section 2 summarizes the review of IIT’s literature and theoretical background of IIT. Section 3 provides an analysis of Vietnam- ASEAN intra-industry trade in manufactures. Section 4 concludes the paper. 2. Literature Review and Research Methods The intra-industry trade literature began when Balassa (1966) analyzed the within industries of customs union in Europe. Grubel and Lloyd (1975) introduced a comprehensive index to measure IIT. The most obvious explanation for the occurrence of IIT is product differentiation (Krugman, 1980; Lancaster, 1980). Product differentiation occurs in a situation where individual firms in an industry produce different varieties of the same product which are close substitute in consumption and/ or production. Products can be differentiated in three main forms: horizontal, vertical and technological differentiation. Horizontal intra-industry trade (HIIT) is defined as the exchange of products of similar 6
- quality, but different characteristics or attributes. The theoretical basis of HIIT was developed by Lancaster (1980), Krugman (1981), Helpman (1981, 1987), whereas vertical intra-industry trade (VIIT) involves simultaneous export and import of similar goods of varying qualities (Falvey, 1981; Shaked & Sutton, 1984). There are alternative index definitions to calculate intra-industry trade. In this study the well-known Grubel-Lloyd (G-L) Index (1975) is used. The standard G-L intra-industry trade index is computed as follows: where Xi and Mi stand, respectively, for the exports and imports of industry i. IIT index can vary between 0 and 1. The IITi is closed to 1 denotes more trade in industry i or intra-industry trade, whereas, IITi is closed to zero means inter-industry trade. In order to distinguish IIT into its vertical (VIIT) and horizontal (HIIT) components, existing literature shows the consistency in methodology which is based on the assumption that the difference in unit cost of export and import reflects the quality difference in goods of export and import between trading partners (Greenaway, Hine, and Milner, 1995); Fontagné, Freudenberg, and Péridy, 1997; and Aturupane, Djankov, and Hoekman, 1999). Thus, this study uses the ratio of unit value (UV) of export and import as the proxies for product differentiation. Export (import) unit values are obtained by dividing the value of total exports (imports) to total amounts of exports (imports). IIT is considered as horizontal if the export and import values differ by less than % (15, 25, i.e.) if they fulfill following condition: Vertical IIT then is defined as: The reason of using percent in the calculations is that, the transaction costs are estimated to constitute approximately percent of the product prices. To understand the technological level embodied in manufactures trade, exports and imports are decomposed into four categories based on the UNCTAD’s classification of manufactured products by degree of manufacturing groupings as follows: Labor-intensive and resource-based, Low skill and technology intensity, Medium skill and technology intensity, High skill and technology intensity All trade data, unit prices of export/import are collected from the UN Comtrade Database and classified into certain sectors at three-digit level of Standard International Trade Classification (SITC) code. 7
- 3. Development of Vietnam-ASEAN intra-industry trade in manufactures 3.1. Overall trend of Vietnam-ASEAN intra-industry trade in manufactures This section provides the description of the extent, nature and dynamics of manufactured trade between Vietnam and ASEAN countries. Vietnam’s trade of manufacturing goods with ASEAN has maintained an increasing trend over the period of 2007-2016. Vietnam’s manufactures exports to ASEAN rose from $2,736.1million in 2010 to $13,372.6million in 2016, while imports over this period grew from $9,1.3.2million to nearly $16 billion (table 1).Although the shares of manufacturing goods in Vietnam- ASEAN trade increased between 2007 and 2016, Vietnam’s manufactured imports grew at an annual average rate of 6.33 percent, while it’s exports to ASEAN grew at annual average rate of 19.28 percent during this period. Table 1. Vietnam’s Manufactured Trade with ASEAN: 2007-2016 Unit: $US million & percent Annual 2007 2010 2013 2016 Growth Manufactured exports 2,736.1 4,915.1 12,555.4 13,372.6 19.28 Share of total exports 33.74 47.42 67.56 76.64 Manufactured imports 9,103.2 9,826.5 13,510.3 15,820.6 6.33 Share of total Imports 57.22 59.89 63.47 65.68 Source: Calculated from UN comtrade data Table 2 presents the trends in technology intensity of Vietnam-ASEAN manufactured trade in the period of 2007-2016. As shown in table 2, trade in manufacturing between Vietnam and ASEAN was mostly driven by high-technology industries, which accounted for about 42 percent and 44 percent of Vietnam’s manufactured exports and imports in 2016, respectively. However, the share of trade in high-technology manufactures started to decrease from 2000. Over the same period, the share of imports in medium-technology manufactures rose considerably, from 23.54 percent to 32.74 percent, while the corresponding figure for export decreased from 32.41 percent to 18.52 percent. Low-technology industries are also an important item in Vietnam-ASEAN export structures, which accounted for approximately 16 percent of Vietnam’s manufactured exports to ASEAN in 2016. Low-technology products are important in exports than in imports while high-technology products are relatively more important in imports than in exports. Vietnam-ASEAN manufactured trade structures show a considerable shift, which is from high-technology industries towards medium-technology and low-technology industries in Vietnam’s exports to ASEAN. This shift is most consistent with the technological catching-up progress in ASEAN countries. 8
- Table 2. Vietnam-ASEAN’s manufactures trade by degree of technology Unit: percent 2007 2010 2013 2016 Category1 Export Import Export Import Export Import Export Import Labour-intensive and 21.84 13.01 22.43 15.91 16.96 13.39 21.83 12.87 resource-based Low skill and 20.68 16.26 22.26 14.63 20.73 5.98 15.93 5.71 technology intensity Medium skill and 32.41 23.54 21.56 27.31 15.34 25.24 18.52 32.74 technology intensity High skill and 23.71 40.89 29.73 36.19 46.34 52.62 42.77 44.71 technology intensity Unclassified 1.36 6.31 4.02 5.96 0.63 2.76 0.95 3.98 Source: calculated from UN comtrade data The pattern of intra-industry trade can be further analyzed by computing the IIT levels for each industry at the disaggregated industrial level. Table 3 present the top 10 highest IIT levels of manufactured products at 3-digit level of Standard International Trade Classification (SITC). Of these major product groups, Engines and motors, non-electric (SITC code 714) recorded the highest IIT levels. Overall, the top 10 products with high level of IIT differed from different trade partners. In 2016, product groups with high intra- industry trade varied differently from country to country. This indicates the significant diversification of Vietnam’s trade in manufactures with ASEAN. Table 3. Highest IIT index in Vietnam-ASEAN Manufacturing Trade in 2016 SITC SITC Product Name IIT Product Name Code Code IIT Engines and motors, non-electric (other than those of groups 712, Sanitary, plumbing and heating 714 1.000 812 0.962 713 and 718); parts, n.e.s., of fixtures and fittings, n.e.s. these engines and motors Civil engineering and Metal containers for storage or 723 contractors' plant and equipment; 0.993 692 0.958 transport parts thereof Household equipment of base 697 0.990 892 Printed matter 0.956 metal, n.e.s. Fertilizers (other than those of Plates, sheets, film, foil and 562 0.983 582 0.936 group 272) strip, of plastics Paper and paperboard, cut to size Non-electric parts and 642 or shape, and articles of paper or 0.978 749 0.924 accessories of machinery, n.e.s. paperboard 1 Categories based on the UNCTAD’s classification of manufactured products by degree of manufacturing groupings 9
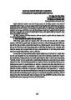
- Taps, cocks, valves and similar appliances for pipes, boiler shells, tanks, vats or the like, 884 Optical goods, n.e.s. 0.973 747 0.918 including pressure-reducing valves and thermostatically controlled valves Furniture and parts thereof; bedding, mattresses, mattress 821 0.972 893 Articles, n.e.s., of plastics 0.901 supports, cushions and similar stuffed furnishings Other machinery and equipment 728 specialized for particular 0.970 633 Cork manufactures 0.896 industries; parts thereof, n.e.s. Non-electrical machinery, tools Perfumery, cosmetic or toilet 553 0.969 745 and mechanical apparatus and 0.894 preparations (excluding soaps) parts thereof, n.e.s. Rubber tyres, interchangeable 678 Wire of iron or steel 0.963 625 tyre treads, tyre flaps and inner 0.894 tubes for wheels of all kinds Source: calculated from UN comtrade data, 2017 3.2. Components of Vietnam-ASEAN intra-industry trade in manufactures The development of IIT and its components as measured by the G-L index over the period 2007-2016 for manufactured trade between Vietnam and ASEAN6 are presented in figure 1, 2 and 3, respectively. As can be seen from figure 1, the overall IIT levels among Vietnam-ASEAN countries had risen consistently over the period of 2007-2016, reflecting the increasing importance of IIT in trade between them. The levels of IIT are from the lowest degree of 0.21 in 2007 to the highest degree of 1.00 in 2012. Among partners, Indonesia and Malaysia have the highest levels of IIT with Vietnam (1.00 in 2012). In general, average IIT indices for six ASEAN countries are high and differed among countries over the reported period. The high levels of IIT may indicate that traditional factor endowment theory still holds true for Vietnam-ASEAN manufactured trade and reveal the trade pattern of similar factor endowment countries. 10
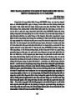
- Figure 1. Intra-Industry Trade (G-L index) in Manufactures between Vietnam and selected ASEAN countries Source: calculated from UN comtrade data In the case of VIIT, the levels for Vietnam-Indonesia (0.49 in 2012) and Vietnam- Thailand (0.46 in 2013) exceeded the levels of Vietnam with other partners(figure 2).This is reasonable because among ASEAN6, Indonesia and Thailand are relatively at higher degree of industrialization than that of Vietnam. However, the VIIT levels of all countries showed relatively little progress over the period of 2007-2016. The high share of vertical IIT shows that IIT between Vietnam and ASEAN6 countries arises from quality differences in exports of manufacturing industries. In other words, this indicates the ASEAN’s imports of low quality and technologically inferior products from Vietnam. Figure 2. Vertical Intra-Industry Trade (G-L index) in Manufactures between Vietnam and selected ASEAN countries Source: calculated from UN comtrade data 11
- Compared with the value of vertical intra-industry trade, the value of horizontal intra-industry trade is higher and varied significantly from year to year (figure 3). The exception is Malaysia, which has the level of HIIT of approximately 0.47in 2016. The horizontal IIT levels are similar for Indonesia and Thailand, and are higher than that of other countries. Figure 3. Horizontal Intra-Industry Trade (G-L index) in Manufactures between Vietnam and selected ASEAN countries Source: calculated from UN comtrade data, 2012 The shares of Vietnam-ASEAN6 manufactured trade by IIT’s components for the period of 2007-2016 are reported in table 4. As can be seen, manufactured trade between Vietnam and ASEAN6 is dominated by horizontal IIT, which accounted for over 40 percent over the reported period. This reflects similarities in income levels, factor endowments, human capital and technology intensities between similar trading nations. This also confirms the role of country-specific determinants of IIT and the predominance of South-South trade flows in the case of Vietnam-ASEAN. However, from 2010, the trade shares of vertical IIT increased, which is likely resulted from the effect of economic scale, the industrialization progress of ASEAN’s countries and the effects of the Vietnam- ASEAN FTA. Table 4. Shares of Manufactured Trade by IIT Components (%) 2007 2008 2009 2010 2011 2012 2013 2014 2015 2016 VIIT 15.26 14.70 19.02 12.05 16.47 13.40 10.04 11.16 12.81 19.63 HIIT 53.73 57.08 58.94 61.05 53.21 42.54 42.32 46.12 43.28 55.21 Non 31.01 28.22 22.04 26.91 30.31 44.06 47.64 42.72 43.90 25.17 specified Source: calculated from UN comtrade data, 2016 12
- 4. Conclusion This paper has provided an empirical analysis of Intra-industry trade in manufacturing sector between Vietnam and ASEAN’s main trade partners for the period of 2007-2016. In this study not only the levels of IIT, but also its vertical and horizontal components are analyzed. The IIT’s results demonstrate the increasing importance of IIT in manufacturing trade between the two parties. The share of IIT in Vietnam’s trade with ASEAN is relatively high and rises consistently over the reported period, reflecting the increasing importance of IIT in manufacturing trade between them. Another important point about our findings is that horizontal IIT has an importance in Vietnam’s manufacturing trade with a share of over 40 percent in total IIT. This high share of horizontal IIT means that Vietnam’s IIT mainly covers the two-way trade of commodities that are similar in quality, but different characteristics or attributes. This study has contributed to literature of IIT analysis of Vietnam’s manufacturing sector, by which, IIT is classified by degree of technology and specific market. Although the results are not directly connected to the policy instruments, policy implications may be inferred from the results. This study shows that there is a growing importance of intra-industry trade between Vietnam and ASEAN countries which is beneficial for both parties because of increasing the economy’s welfare. Thus, encouraging intra-industry trade can be a very efficient way to raise national welfare. There is the need for policy makers of ASEAN countries to make efforts to ensure the effective implementation of the Vietnam-ASEAN free trade agreement scheme in order to enhance value addition to the manufactured products. This is important, not only to sustain horizontal and vertical differentiation of manufactured products in general, but in making sure that intra-industry trade would be sustained and improved. REFERENCES 1. Chemsripong, Sujinda, Agbola, Frank W. and Lee, Julie E. (2005), “Intra-Industry Trade in Manufactures between Thailand and Other Asia Pacific Economic Cooperation (APEC), Countries”,Applied Econometrics and International Development, Vol. 5, No. 4, 2005. Available at SSRN: http://ssrn.com/abstract=1238663 2. Chin Mui Yin, Day-Yin Tan and Mui-Yin Chin, (2017), “ASEAN-China Trade Flow: A Study on Intra-Industry Trade in Manufacturing Sector”, Advanced Science Letters, 23, 4, pp. 2691 3. Das, Gouranga G., 2003. "Growth and Pattern of Intra-Industry Trade in Manufactures in Inida's Overall Trade:A Quantitative Analysis," MPRA Paper 37919, University Library of Munich, Germany, revised 2005. 4. DurkinJr, J.T.and Krygier, M. (2000), “Differences in GDP per capita andthe share of intra-industry trade: The role of vertically differentiated trade”, Review of International Economics, vol.8(4), pp. 760-774. 5. Falvey, R. and Kierzkowski, H. (1987),“Product Quality, Intra-Industry Trade and (Im)Perfect Competition”,in H. Kierzkowski (ed.), Protection and Competition in 13
- International Trade. Essays in Honor of W.M. Corden , Oxford, United States: Basil Blackwell (1987),pp. 143-161. 6. Fontagné, L. M., Freudenberg, and Péridy, N. (1997),“Trade Patterns inside the Single Market”,CEPII Working Paper No.97-07 7. Greenaway, D., Hine, R. and Milner, C. (1995),“Vertical and Horizontal Intra-Industry Trade: A Cross Industry Analysis for the United Kingdom”,The Economic Journal, 105, 433, pp. 1505-1518. 8. Grubel, H.G. and Lloyd,P.J. (1975),“Intra-Industry Trade: The Theory and Measurement of International Trade in Differentiated Products”, John Wiley & Sons: London. 9. Helpman, E. and P. Krugman, P. (1985).“Market Structure and Foreign Trade”, Brighton, United Kingdom: Harvester Wheatsheaf . 10. Jambol, A.B., Ismail, N.W. (2013). Intra-Industry Trade in Malaysian Manufacturing Sector. PROSIDING PERKEM VIII, JILID 1 (2013) 119 - 129 11. Jha, A. K. and Saha, S. (2011) ‘Intra-Industry Trade inAsean-5: An Overall and Country-Specific Study’, Journal of International Economics, Vol. 2, No. 2, pp. 17-24. 12. Kumar, Sushil. (2014). Growth and Pattern of Intra-Industry Trade between India and Bangladesh: 1975-2010. International Economic Policy. 2. 13. Krugman, P. (1980), “Scale Economies, Product Differentiation, and the Pattern of Trade”, American Economic Review, 70, pp. 950-959. 14. Lancaster, Kelvin, J.(1980),“Intra-industrytradeunderperfect monopolisticcompetition”, Journalof International Economics, 10, pp. 151-175. 15. Menon, J. (1996), Intra-industry trade and the ASEAN Free Trade Area.Pacific Economic Paper No. 251, Australia-Japan Research Centre, Melbourne Australia, January. 16. Shaked, A. and Sutton, J. (1984), “Natural Oligopolies and International Trade”(in): Kierzkowski, H. (ed.), Monopolistic Competition and International Trade. Oxford University Press, Oxford, USA, pp. 34-50, 1984 17. Wiklander, Julia, (2008), “Singapore and ASEAN: A Study on Intra-Industry Trade”, available at: http://lup.lub.lu.se/student-papers/record/1337000 14
- FACTORS AFFECTING PURCHASING INTENTION OF VIETNAMESE CUSTOMERS THROUGH DIRECT SELLING MODEL CÁC YẾU TỐ ẢNH HƯỞNG ĐẾN Ý ĐỊNH MUA HÀNG CỦA KHÁCH HÀNG VIỆT QUA MÔ HÌNH BÁN HÀNG TRỰC TIẾP Msc. Duong Dac Quang Hao College of Economics, Hue University Abstract This study aims to develop and test the integrative model of factors affecting purchasing intention of customers through direct selling model in a developing country case. Both qualitative research method and quantitative one are applied. Data are collected from a sample of 216 customers of Amway, Oriflame, and Herbalife who bought products or participated in the direct selling system. Regression analysis then is used to test the hypothesized correlations. The research results show that: (1) there are 6 principal groups of factors affecting consumer buying intention; (2) Interpersonal relationship (IR) and product perception (PP) are the two factors that have the greatest impact on the dependent variable with regression coefficients of 0.364 and 0.362 respectively; (3) Differentiation analysis shows that female customers, age 22 to 40 years old, source information from customer conferences and purchase through this channel have the highest willingness to buy products from direct selling model. Keywords: Direct selling model, Amway, Vietnam. Tóm tắt Nghiên cứu được thực hiện nhằm phát triển và thử nghiệm mô hình tích hợp các yếu tố ảnh hưởng đến ý định mua hàng của khách hàng thông qua mô hình bán hàng trực tiếp ở trường hợp của một nước đang phát triển. Cả hai phương pháp nghiên cứu định tính và định lượng đều được áp dụng. Dữ liệu được thu thập từ mẫu gồm 216 khách hàng của Amway, Oriflame và Herbalife đã mua sản phẩm hoặc tham gia vào hệ thống bán hàng trực tiếp. Phân tích hồi quy sau đó được sử dụng để kiểm tra các giả thuyết về mối tương quan giữa các nhân tố. Kết quả nghiên cứu cho thấy: (1) có 6 nhóm nhân tố chính ảnh hưởng đến ý định mua hàng của người tiêu dùng; (2) Mối quan hệ giữa các cá nhân (IR) và cảm nhận về sản phẩm (PP) là hai yếu tố có tác động lớn nhất đến biến phụ thuộc với hệ số hồi quy lần lượt là 0,336 và 0,362; (3) Phân tích khác biệt cho thấy khách hàng nữ, từ 22 đến 40 tuổi, tiếp thu nguồn thông tin từ hội nghị khách hàng và mua hàng qua kênh này có mức độ sẵn sàng mua sản phẩm từ mô hình bán hàng trực tiếp cao nhất. Từ khóa: Mô hình bán hàng trực tiếp, Amway, Việt Nam. 1. Introduction Direct Selling (or network marketing) is a type of marketing of special products creating a social network of distributors at multiple levels of profits. This is an alternative to traditional marketing. Direct selling is mainly important for its advantage of saving the 15
- costs of advertising for the company by taking advantage of peoples’ word of mouth marketing, and sharing the profits with these people (Larson, 2008). In the recent years, direct selling model continues to gain strength as a strategic marketing alternative for many companies across the World. According to the World Federation of Direct Selling Associations (WFDSA, 2019), in 2018 alone the global industry summed up sales of US$252,823 millions, with up to 6.4% increase in 2018. Over a three-year period (2015-2018) the direct selling industry register a 6.4 % growth in sales and total of 99,724,641 direct sellers. Especially, this selling model now is being expanded and thrived in many Asian countries, such as China, Japan, Vietnam (Gage, 2001). However, this rapid growth has led to many negative social issues relating to fraudulent business, origin and price of products,... In fact, in Vietnam, many companies based on direct selling model have changed the standard model with the aim of generating illicit profits for Figure 1. Binary plan - one of the themselves. They try to create a multi-level system most popular plans in direct selling focusing on recruiting new participants, instead of selling model [15] products (Figure 1). These companies take advantage of asymmetric information to earn profit from late participants. Regarding the academic aspect, along with the increasing concerns of changing in direct selling model, the topic of assessing the effectiveness of this model thus has been recognized as a field of growing interest worldwide (Donovan, 2014). Many research has been implemented to develop the evaluation scale of factors affecting the success of this model (Balfagih, 2016; Gage, 2001, Jaramillo et. al., 2009). Some authors interest in clarifying the perceptions of customers to this selling model (Cheung et. Al., 2005). Despite the increase in the number of related researches, there are still gaps in the knowledge base. Namely, it is still lack of efficient quantitative model to measure the factors affecting purchasing intention of customers through direct selling model. Further, the relationship between customers’ demographic features and their purchasing behaviours have not quantified clearly yet. Besides, although numerous scholars in sales management have developed quantitative scales to assess direct selling model in developed countries (Cheung et. al., 2005). The evaluation scale of these selling factors was not thoroughly tested in the practice of a developing country, such as Vietnam (Luck et. al., 2009) Stemming from the above urgent problems, based on the business practices of Amway, Oriflame and Herbalife in Vietnam, this study was carried out with two main objectives: 16
- Analyze the factors affecting purchasing intention of Vietnamese customers through direct selling model Propose feasible solutions to help direct sellers improve their selling activities and attract more customers. 2. Literature review The method of bringing goods and services to market and selling them directly to consumers, at a non-fixed point of sale constitutes the mere definition of direct selling (Young, 2003). Specifically, the sale of a product or service takes place face-to-face succeeding a real-time demonstration of its features. The demonstration is completed either individually or a larger groups of prospects (Figure 2). In certain conditions, orders can also be placed later based on a individual price agreement or based on a catalog offer. In comparison to other marketing channels, direct selling is formed on personal contact with the customer (Brown, 2012). Figure 2. Comparision of direct Selling Model and traditional one (Source: Young, 2003) Presently, direct selling signifies a growing market segment, precisely because it offers a foremost cost-effective advantage of marketing products and services without relying on the traditional marketing circuit or an existing retail channel (Yao et. al., 2003). Defined as the “face-to-face selling of consumer goods” minus the premises of a fixed retail location, direct selling differentiates greatly from direct marketing. Peterson and Wotruba (1996) describe direct marketing as a causal process through which products are retailed to the consumer using direct mailing, telemarketing and direct response instruments such as radio spots, banners, infomercials and/or television advertising,... In contrast, direct selling favors individual one-to-one sales presentations rather than an indirect course of selling events (Peterson and Wotruba, 1996). Crittenden (2004) identify the key distinguishing factor between the two of them as personal focus or face-to-face interactions through which personal relationships with consumers are created. According to Blech (2006) "the direct personal presentation, 17
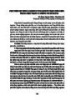
- demonstration, and sale of products and services to consumers, usually in their homes or at their jobs” enables the seller to display wider product expertise and convenience for the prospect (King and Robinson, 2000). The importance of the direct non-store retailing approach has increased in the previous years, ranking up within traditional marketing techniques for selling and distributing products and services (Jaramillo and Grisaffe, 2009). This is signaled also by the significant amount of research generated in the literature. Regarding customers in direct selling, the research of Merrilees and Miller (2009) reveals that customers' interaction differs in direct selling depending on the company and the promoters. Some customers are purchasing from direct selling companies because of their need for the product, while other customers are attracted by the way that the promoter promotes to them (Balfagih, 2016). Some prospective customers are losing trust in this kind of business due to their belief that the purpose of the company and promoter is just to sell and earn, without considering the value of the product and the quality of the online system. Moreover, the lack of trust is a result of confusion between two concepts; the direct selling and some pyramid schemes which represent a form of illegal scam business (Tokaji-Nagy, 2016). Regarding the evaluation scale of customer purchasing intention, there have been a number of recent empirical attempts to validate the typical factors affectting customers thinking and their behaviours (Tokaji-Nagy, 2016; Wotruba, 2001). Through these research, six main elements has been highlighted, including: Self identity (Donovan, 2014), a cognitive link between purchasing behaviour and the identification of personal features (characteristics, demographics, social status). Firm’s reputation (Larson, 2008), consumers can and will rely on (reputation) as the basis for inferences for missing product attributes. A solid reputation makes people believe “especially extreme” advertising claims more easily. Customers will buy more easily from firms with a good reputation. Interpersonal relationship (Merrilees and Miller, 1999), individuals or groups that have close relationship with potential customers. These direct sellers affect on customers’ opinions, beliefs, attitudes and behaviors. In other words, this relationship influence how consumers interpret information and make purchasing decisions. Product perception (Young and Albaum, 2003), this factor relates to product features, perceived usefulness and perceived ease of use. Better product perception would raise the customers’ willingness-to-pay and stimulate their purchasing behaviour. Price perception (Gage, 2001), this element is one of the leading variables when it comes to consumers buying process. Economists, market researchers have already undergone researches and predict that in buying decision price are the driving forces. Several studies explain and determine and explain the same fact thereby concluding the fact with decision making. The determinants of price perception can be both rational and psychological factors. Promotion policies (John, 2000), this factor refers to any type of marketing communication used to inform or persuade target audiences of the relative merits of a 18
- product, service, brand or issue. The aim of promotion is to increase awareness, create interest, generate sales or create brand loyalty. In this study, the author build up such a framework based on the above-mentioned six factors and considering the in the practical situation in Vietnam. The suggested research model and evaluation scale are tested through the qualitative research step (Figure 3). Self Identity (SELF) H1 Firm’s Reputation (FR) H2 Interpersonal Relationship (IR) H3 PURCHASING INTENTION Product perception (PP) H4 Price Perception (PRICE) H5 Promotion Policies (PRO) H6 Figure 3. Suggested research model Table 1. Analytical hypotheses Hypothesis Description H1 Self Identity (SELF) positively affects on purchasing intention. H2 Firm’s Reputation (FR) positively affects on purchasing intention. H3 Interpersonal Relationship (IR) positively affects on purchasing intention. H4 Product perception (PP) positively affects on purchasing intention. H5 Price Perception (PRICE) positively affects on purchasing intention. H6 Promotion Policies (PRO) positively affects on purchasing intention. 3. Research method Data collection In this study, the author utilized both qualitative data and quantitative one. Namely, the secondary data was collected from Vietnam General Statistical Office, Department of Competition and Consumer Protection, and internal data of Vietnam branches of Amway, Oriflame and Herbalife. These data sources provide an overview of sales activities in Vietnam market, detailed of fraudulent case, and the personnel situation of the above-mention companies. The qualitative research step then is implemented to discuss the adjusted measurement scales and proposed hypotheses and integrated model. In this step, in-depth interview and group discussion methods are used explore the view of 11 experts (including 2 senior researchers who are knowledgeable about the research topic, and 9 experienced direct sellers from three targeted companies: Amway, Oriflame and Herbalife). The average time for an 19
CÓ THỂ BẠN MUỐN DOWNLOAD

-

Kỷ yếu Hội thảo khoa học: Vai trò văn hóa kinh doanh trong kinh tế thị trường định hướng xã hội chủ nghĩa ở Việt Nam
 244 p |
  63
|
63
|  21
21
-

Quản trị rủi ro và phát triển đô thị bền vững - Hội thảo khoa học Quốc tế
635 p | 20
| 13
-

Hạ tầng cho phát triển hệ thống logistics ở Việt Nam và vùng kinh tế trọng điểm miền Trung
18 p | 14
| 8
-

Thương mại và phân phối lần thứ 3 năm 2022 - Kỷ yếu hội thảo khoa học Quốc tế (Tập 1): Phần 1
428 p | 13
| 7
-
Bàn về đào tạo và phát triển nguồn nhân lực logistics Việt Nam
9 p | 11
| 7
-

Triển vọng phát triển hệ thống logistics quốc gia và vùng KTTĐMT trong hội nhập quốc tế
5 p | 11
| 6
-
Đào tạo nguồn nhân lực logistics vùng kinh tế trọng điểm miền Trung
8 p | 7
| 6
-

Giải pháp phát triển nguồn nhân lực logistics vùng kinh tế trọng điểm miền Trung
6 p | 13
| 6
-
Thực trạng logistics vùng kinh tế trọng điểm miền Trung: Những vấn đề đặt ra và và giải pháp
10 p | 28
| 6
-
Phát triển hệ thống logistics vùng kinh tế trọng điểm miền Trung: Thực trạng và những vấn đề đặt ra
11 p | 12
| 6
-

Khái quát hệ thống logistics quốc gia
13 p | 16
| 6
-
Thương mại và phân phối lần thứ 3 năm 2022 - Kỷ yếu hội thảo khoa học Quốc tế (Tập 2): Phần 2
273 p | 16
| 6
-

Thương mại và phân phối lần thứ 3 năm 2022 - Kỷ yếu hội thảo khoa học Quốc tế (Tập 1): Phần 2
302 p | 15
| 6
-

Hội thảo khoa học Quốc tế: Khởi nghiệp và sáng tạo - Cơ hội và thách thức đối với doanh nghiệp Việt Nam (Tập 2)
710 p | 17
| 6
-

Dự báo dòng hàng hóa lưu chuyển vùng kinh tế trọng điểm miền Trung đến năm 2045
12 p | 9
| 6
-

Thực trạng phát triển hệ thống logistics vùng kinh tế trọng điểm miền Trung
12 p | 12
| 5
-

Thương mại và phân phối lần thứ 3 năm 2022 - Kỷ yếu hội thảo khoa học Quốc tế (Tập 2): Phần 1
411 p | 10
| 4


Chịu trách nhiệm nội dung:
Nguyễn Công Hà - Giám đốc Công ty TNHH TÀI LIỆU TRỰC TUYẾN VI NA
LIÊN HỆ
Địa chỉ: P402, 54A Nơ Trang Long, Phường 14, Q.Bình Thạnh, TP.HCM
Hotline: 093 303 0098
Email: support@tailieu.vn
Giấy phép Mạng Xã Hội số: 670/GP-BTTTT cấp ngày 30/11/2015 Copyright © 2022-2032 TaiLieu.VN. All rights reserved.

