


Medical doctoral thesis summary: Study on the hemodynamic efects of phenylephrine in the management of hypotension during spinal anesthesia for cesarean section
lượt xem 5
download
 Download
Vui lòng tải xuống để xem tài liệu đầy đủ
Download
Vui lòng tải xuống để xem tài liệu đầy đủ
This topic is conducted with the two following objectives: Compare the effects of phenylephrine with ephedrine on hemodynamic measured by the non-invasive method Niccomo in the management of the hypotension during SA for cesarean section; to evaluate some undesirable effects of phenylephrine and ephedrine on mother and newborn during SA for cesarean section.
Bình luận(0) Đăng nhập để gửi bình luận!
Nội dung Text: Medical doctoral thesis summary: Study on the hemodynamic efects of phenylephrine in the management of hypotension during spinal anesthesia for cesarean section
- MINISTRY OF MINISTRY OF HEALTH EDUCATION AND TRAINING HANOI MEDICAL UNIVERSITY STUDY ON THE HEMODYNAMIC EFECTS OF PHENYLEPHRINE IN THE MANAGEMENT OF HYPOTENSION DURING SPINAL ANESTHESIA FOR CESAREAN SECTION Specialized in : Anesthesiology Code : 62 72 01 21 MEDICAL DOCTORAL THESIS SUMMARY HA NOI - 2019
- WORKS ARE COMPLETED AT HANOI MEDICAL UNIVERSITY Science instructor: Professor NGUYEN Quoc Kinh The thesis will be presented in School thesis council At … h00, day ……. month …..year 2019 The thesis can be found at: - National library - Library of Hanoi Medical University
- ABBREVIATIONS BMI : Body Mask Index CO : Cardiac Output CI : Cardiac Index ECG : Electrocardiogram GTTS : Spinal anesthesia – SA HA : Blood pressure – BP HATT : Systolic arterial blood pressure – SBP – SAP HATTr : Diastolic arterial blood pressure – DBP, DAP HATB : Mean blood pressure – MAP HR : Heart Rate ICG : Impedance Cardiogram NMC : Epidural anesthesia Niccomo : Non Invasive Continuous Cardiac Output Monitoring SpO2 : Saturation of oxygenation SV : Stroke Volume SVV : Stroke Volume Veriation SVR : Systemic Vascular Resistance
- 1 INTRODUCTIONS Anesthesia in obstetrics for cesarean section increased due to the increasing the rate of cesarean section, which is a great concern of the anesthesiology because of the achievement of analgesic effect, good muscle relaxation to maximum facilitate the operation, ensuring safety for both mother and infant. Spinal anesthesia is preferred to anesthesia, is the first choice for cesarean section, hypotension when the Spinal anesthesia accounts for as high as 70% -80%. It is the most dangerous complication, causing bad consequences for mothers and children. Therefore, the problem of managing hypotension is always concerned and studied. The mechanism of hypotension in the spinal anesthesia (SA) is due to blockade of the sympathetic ganglion, leading to dilatation of the arterial system (resistance system), which reduces SVR and veinous dilatation (storage system) reduces venous return in a reduction of the preload and a decrease CO. The blood pressurs (BP) is directly proportional to CO and SVR. Thus hypotension can be due to decreased SVR and / or decreased CO. But reducing SVR also reduces afterload so it can improve CO. There have been studies on infusions around the world (comparing preload with coload, crystalloid and colloid fluids). Compare phenylephrine effect with ephedrine on the mother and children. At present, there are no or less invasive hemodynamic monitoring methods such as CNAP, Clearsight, Niccomo, USCOM… So in the world there are only a few studies on hemodynamic changes in SA. There have been no studies to assess the hemodynamic changes of pregnant women, umbilical cord blood gas in during the cesarean, of phenylephrine and ephedrine in particular when used to treat hypotension. Therefore, this topic is conducted with the two following objectives: 1. Compare the effects of phenylephrine with ephedrine on hemodynamic measured by the non-invasive method Niccomo in the management of the hypotension during SA for cesarean section. 2. To evaluate some undesirable effects of phenylephrine and ephedrine on mother and newborn during SA for cesarean section. *New contributions of the thesis: 1. Scientific and practical meanings: - The research is very necessary, to be new, especially when applying noninvasive hemodynamic monitoring method (Niccomo monitoring), the thesis has scientific and
- 2 practical significance. Proper, scientific and logical research design; The datas and the datas processing are reliable, the number of patients are large enough. - Ever, the main drug used is ephedrine to treat hypotension in the spinal anesthesia. However, the ephedrin is suspected of causing fetal acidosis in recent years. Therefore, foreign and domestic authors have come to phenylephrine to replace ephedrin. - The authors only researched and used the phenylephrine to increase blood pressure. No authors studied hemodynamic changes (BP, CO, SV, SVR, HR) by phenylephrine. This is the new point, the contribution of the topic to clinical practice and science. 2. The thesis has scientific significance, is up to date and very valuable in clinical gynaeco-obstertrical anesthesia: - The thesis compares the efficacy of the new vasoconstrictor that is phenylephrine versus the previously used vasoconstrictor, ephedrine, both of which are infused continuously to prevent the hypotension in the spinal anesthesia for cesarean section. - This study used a new hemodynamic monitoring method that is Niccomo system to continuously monitor hemodynamic indicators: heart rate, arterial blood pressure, cardiac output, stroke volume and the systemic vascular resistance. This hemodynamic monitoring method helps to accurately assess the effectiveness of the two vasoconstrictor drugs above and helps to guide the fluid infusion to manage hypotension during spinal anesthesia for cesarean section. *Layout of the thesis: The thesis consists of 113 pages (excluding references and appendices) of which: Introduction: 02 pages; Chapter 1 - Overview: 32 pages; Chapter 2 - Objects and Methods: 16 pages; Chapter 3 - Results: 27 pages; Chapter 4 - Discussion: 34 pages; Conclusion: 2 pages. The thesis has 38 tables; 12 photos; 10 charts; 124 references (25 documents in Vietnamese and 99 documents in foreign languages). CHAPTER 1 - OVERVIEW 1.1. Physiological and anatomial changes in pregnant women are related to anesthesia: During pregnancy, there are many changes in the circulation and cardiovascular. Total blood volume increased to 35%, plasma volume increased to 45%, hemoglobin decreased by 15% compared to normal, HR increased by 15% compared to the original, the SV increased by 30%, but SVR 15% off. CO increased by 30% to 40% in the first trimester, the months after, it increased less. During labor, CO increases due to increased HR and SV. Each contraction of the uterus increases CO and maternal circulation by 10-25%. The
- 3 highest increase in CO immediately after having the birth, it can exceed 80% of the pre-labor value. 1.2. Uterine circulation: At term, uterine blood flow accounts for 10% of CO, which is 600-700 ml/min compared to 50 ml/min in a non-pregnant uterus. Up to 80% of uterine blood flow is for placenta, the rest for uterine muscle. During pregnancy, the uterine vascular system maximum dilated, so it loses its self-regulation mechanism, although it is still sensitive to α receptor stimulants. The uterine vascular system has many α receptors and few β receptors. 𝐌𝐀𝐏 − 𝐔𝐭𝐞𝐫𝐢𝐧𝐞 𝐯𝐞𝐧𝐨𝐮𝐬 𝐩𝐫𝐞𝐬𝐬𝐮𝐫𝐞 𝐔𝐭𝐫𝐢𝐧𝐞 𝐛𝐥𝐨𝐨𝐝 𝐟𝐥𝐨𝐰 = 𝐔𝐭𝐞𝐫𝐢𝐧𝐞 𝐯𝐚𝐬𝐜𝐮𝐥𝐚𝐫 𝐫𝐞𝐬𝐢𝐬𝐭𝐚𝐧𝐜𝐞 Uterine blood flow is directly proportional to the difference in pressure between the arteries and uterine veins, inversely proportional to uterine vascular resistance. Normally, MAP is 80 mmHg in torsion arteries, the uterine venous pressure at rest is 10 mmHg, so the Uterine blood flow - the fetus at rest is 70 mmHg. 1.3. Comparision general anesthesia and spinal anesthesia for cesarean Table 1.1. Comparision general anesthesia and spinal anesthesia for cesarean Spinal anesthesia General anesthesia The patient is awake, witnessing the moment Patient has anesthesia when the child is born in the happiness Simple technique, easy to do Need more equipments, ventilator machine, more complex drugs Avoid the risk of reflux inhalation of gastro The risk of reflux, may be difficult content, to avoid the difficult intubation intubation Patients are at risk of hypotension if not Less risk of hypotension managed effectively The time to inject the drugs to surgery is
- 4 According to the "International Consensus of Resuscitation Anesthesia in 2017" and "Guidelines of American Association of Resuscitation Anesthesia in 2016", we select SP for cesarean section and research the management plan for hypotension caused by SA. 1.4. Mechanism of hypotension in the spinal anesthesia In the SA, numbness higher level increases sympathetic nerve blockade. If the level of blockage is up to T1-T4, there are sympathetic fibers that inhibit the heart nerve, slow down the heart rate to danger, astolic and cardiac arrest if not properly and timely managed. When the anesthetic spreads even higher, the whole SA will cause cardiac arrest, apnea. The SA leads to blockade of pre-sympathetic fibers, the ganglions from T1- L2, causing vasodilation and hypotension. The dilated arterial system (resistance system) reduces afterload resulting in a decrease in SVR causing hypotension. The venous system (the capacitance) reduces the return circulation (venous return) causing a reduction the preload, leading to CO reduction causing hypotension. 1.5. Pharmacological comparision phenylephrine and ephedrine: phenylephrin ephedrin - Directly effect on α1-receptors - Directly effect on α, β receptors (aterial constriction) - Indirect effect by stimulating - Indirect effect due to release of noradrenalin secretion norepinephrine from cysts in the circulation - Rapidly cause habituation: the effect decreases with repeated use - Onset: 42 sec - Onset: 90 sec - Duration: 20 minutes - Duration: 60 min after IV 10-25mg - Bradycardia - Tachycardia - CO: = or ↓ - CO: = or ↑ - The drug does not cross the placenta - The risk of fetal acidosis - Do not cause fetal acidosis - Cross the placenta *Indications: to solve hypotension in the SA, in the epidural anesthesia, in the operaton or in the obstertrical gynaecology 1.6. Cardiac output measurement: non-invasive continuous Niccomo - is a non- invasive biological impedance cardiogram technique invented by Kubicek to measure CO in NASA. Use high-frequency, low-intensity currents through the chest. CO is
- 5 measured due to changes in electrical conduction caused by blood flow in the thoracic aorta. This is a simple and continuous method of measuring CO, SV, SVR ... Table 1.2. Advantages and disadvantages of hemodynamic measurement methods Continous Depend on technically Methods preload invasive Cost Monitoring implementer difficult SWAN - ++ (CVP, + + +++ + ++ GANZ PCWP) PICCO +++ + + ++ ++ + (GEDI, SVV) LIDCO + + + + ++ + (SVV) USCOM ++ - +++ - + - (SVV, FTC) Doppler + thực quản - +++ + + + (FTC) NICCOMO (ICG) ++ + - + -- Each method has its advantages and disadvantages. Which method to choose depends on facilities and doctor’s experience. Niccomo method is non-invasive, quick to set up, easy to apply, continuous measurement in real time, low cost, completely avoiding complications due to invasive methods, easy to accept, accurate measurement results. 1.7. Many studies have managed to hypotension and hemodynamic monitoring: *Viet Nam: - In 2016, Nguyen Quoc Kinh, prevented of hypotension in SA by ephedrine continuous perfusion or fluid infusion. - In 2012, Nguyen Van Minh assessed the effect of stabilizing BP of the hydroxyethyl starch 6% infused before SA for cesarean section. - In 2016, Pham Le Hoan, Đo Van Loi, Sam Thi Qui comparing efficacy of treatment of hypotension due to SA in caesarean section of phenylephrine with ephedrine, these studies have not yet evaluated in detail the hemodynamic changes in surgery and umbilical cord pH value systemically. **Research on hemodynamic monitoring application by Niccomo: - In 2013, Ji-Yeon Kim, to compare the two methods of measuring CO by FloTrac ™/Vigileo ™ monitor and ICG monitor niccomo™ for similar results, the CO value varies by +/- 0.45 liters /minute. - In 2014, Lorne compared measurement of CO by ICG and esophagial doppler in surgery showed the CO value correlated closely between the two methods (r = 0.88
- 6 (0.82-0.94), p
- 7 ml /kg of ringer lactate via peripheral venous catheter in 15 minutes before SA and then maintenance of 100 ml /h during surgery. SA posture lateral left or seat, puncture level L2-3. Dosage of bupivacaine 0.5% heavy 8-10 mg plus fentanyl 0.05 mg. Put your right hip pillow so the uterus is left. *Group P (phenylephrine): as soon as SA, continuous infusion of phenylephrine by electric syringe through separate peripheral intravenous catheter, prophylactic dose of 15 mcg /min until skin closure. If SBP is low ≥20% of baseline, bolus phenylephrine 50 mcg - 100 mcg - 100 mcg / time every 2 minutes if BP is still low. *Group E (ephedrine): Immediately after SA, ephedrine continuous infusion by electric syringe through separate peripheral intravenous catheter, prophylactic dose of 1.5 mg /min until skin closure. If the systolic BP is low ≥ 20% of the baseline, bolus ephedrine 5 mg - 10 mg - 10 mg once every 2 minutes if BP is still low. *If BP is still low after 3 consecutive bolus injections (250 mcg of phenylephrine or 25 mg of ephedrine), then rapid infusion in 15 minutes with 7 ml /kg of Voluven colloid combined plus adrenalin infusion (if maternal heart rate
- 8 Objective 1: Compare the effects of phenylephrine with ephedrine on hemodynamics by non-invasive method Niccomo in the management of hypotension during SA for cesarean section: *Blood pressure: Changes in blood pressure (systolic, mean, diastolic). The percentage of patients with hypotension, the ratio of patients with hypotension per patient, the average level of the lowest BP, comparing the 2 groups. The rate of hypertension after using vasoconstrictor (reactive hypertension). *Heart rate: HR changes of 2 groups at any times. Proportion of patients with bradycardia ( 100 beats/minute). Proportion of patients requiring atropine for management of bradycardia. *CO: Lowest average CO value; highest; change in CO at any times (comparing the two groups). *SVR: SVR change, average SVR lowest, highest for each group, SVR difference between the two groups. *SV: Changes SV of two groups at times. Compare the average SV value at the time of research. The proportion of patients with SV decreased (< 60 ml). *Response to infusion: Average amount of infusion (ringer lactate) (before, during, after procedure and total fluid volume). *Response to vasoconstrictor drugs: The average dose in each patient of the two groups (prophylactic infusion, bolus, total dose). The number of vasoconstrictor bolus used to treat hypotension in the two groups. *Relations between vasoconstrictor dose and hemodynamic parameters: The correlation of vasoconstrictor dose with BP, HR, CO, SVR, SV. *Risk: hypotension, frequency of hypotension, bradycardia, tachycardia for prevention of phenylephrine, ephedrine: odd ratio: OR. Objective 2: Assess some undesirable effects of phenylephrine and ephedrine on maternal and newborn infants in SA for cesarean section: Vomiting and nausea, chills, itching; Apgar: 1 minute, 5 minutes; Umbilical pH (arterial and venous umbilical cord) of the two groups. pO2, pCO2 and BE, HCO3- (artery, vein umbilical cord); Differences in the index of blood gases and acidosis /alkaline, umbilical cord; Other indicators (breathing frequency, SpO2; maternal age, weight, height, BMI, indication of cesarean section, special history, time to start numbness, extent of anesthesia; total time of surgery (characteristics; age, sex of infant, infant weight).
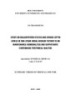
- 9 2.5. Study chart: Patients admitted in Department of Obstertric -Gynaecology, indicated for cesarean Excluded patients: unqualified, not agree to join the research Qualified patients, randomized in to 2 groups Group P, n = 70 patients Group E, n = 70 patients *phenylephrine: continous *ephedrine: continous perfusion perfusion 15mcg/min. Bolus 50- 1,5mg/min. Bolus 5-10-10 mg 100-100mcg every 2 min if every 2 min if hypotension hypotension >20% baseline >20% baselin Analyze, process datas, comparision at 23 points times Group P: n = 70; Analyze: Group E: n = 70; Analyze: - BP, HR, SpO2, CO, SV, SVR… - BP, HR, SpO2, CO, SV, SVR… - Umbilical blood gas Umbilical blood gas - Undesirable effects - Undesirable effects Results Conclusions Picture 2.1. Study chart
- 10 CHAPTER 3 – RESULTS 3.1. Gestational age and infant gender Bảng 3.1. Gestational age and infant sex Goup P Goup E Characteristics p n = 70 n = 70 Gestational age (weeks) 39,10 ± 0,91 39,26 ± 0,77 > 0,05 𝑋 ± SD; (Min-Max) (38-41) (38-42) Infant male/female 34/36 42/28 > 0,05 3.2. Anesthetic characteristics - surgery Table 3.2. The onset time, the Duration of surgery in two groups Goup P Goup E Characteristics p n = 70 n = 70 Onset time (min) 2,53 ± 0,56 2,54 ± 0,52 > 0,05 𝑋 ± SD; (Min-Max) (2-4) (2-3) Duration of operation (min) 62,51 ± 6,74 58,11 ± 6,39 > 0,05 𝑋 ± SD; (Min-Max) (50-100) (40-73) 3.3. Management of hypotension during spinal anesthesia 3.3.1. Infusion during spinal anesthesia Table 3.3. The amount of fluids used in surgery Infusion volume Group P Group E p (ringer lactat, ml) n = 70 n = 70 Preload 447,8 ± 58,0 422,1 ± 75,0 > 0,05 𝑋 ± SD; (Min-Max) (300-500) (200-600) Coloading 206,4 ± 31,7 212,8 ± 76,4 > 0,05 𝑋 ± SD; (Min-Max) (100-300) (100-500) Infusion after vasocontriction stop 184,2 ± 40,4 144,2 ± 53,5 > 0,05 𝑋 ± SD; (Min-Max) (100-300) (100-300) Fluid Total 838,5 ± 66,5 777,8 ± 150,5 > 0,05 𝑋 ± SD, (Min-Max) (700-1000) (200-1300) 3.3.2. Vasoconstrictor used in spinal anessthesia Table 3.4. Vasoconstrictor infusion for solve hypotension Group P Group E Vasoconstrictor used p n = 70 n = 70 Patients need bolus 50 (71,4%) 56 (80,0%) > 0,05 n (%) Vasoconstrictor infusion 183,43 ± 56,77 mcg 14,85 ± 6,58 mg (𝑋 ± SD) (100-300) (5-45) (Min-Max)
- 11 Infusion time of 11,09 ± 3,63 10,50 ± 5,18 vasocontrictor (min), (𝑋 ± SD) > 0,05 (5-20) (5-35) (Min-Max) *The bolus times of vasocontrictors: Bệnh nhân nhóm P 35 nhóm E 30 p< 0,05 27 26 26 25 20 14 15 10 9 10 7 8 5 4 5 2 1 1 0 0 0 lần 1 lần 2 lần 3 lần 4 lần 5 lần 6 lần bolus times Chart 3.1. The bolus times of vasocontrictors 3.4. Change hemodynamic indicators at the research time 3.4.1. Cardiac output changes at point times Chart 3.2. CO changes in the point times (*p
- 12 Group E: From t5 to t11, CO value decrease; CO (at t5) < CO (at t4) with p < 0,05; CO min at t8: 5,75 ± 1,33 litre/minutes. Comparision in two group: from t14 to t22: CO value in group P are lower than CO in group E (p < 0,05). 3.4.2. SVR changes in any research point times Table 3.5. The mean of SVR changes in any research point times Group P Group E Point times 5 p 𝑋 ± SD, dyne-s/cm 𝑋 ± SD, dyne-s/cm5 t1 917,86 ± 130,30 991,12 ± 238,15 t2 905,76 ± 134,66 993,22 ± 234,19 t3 899,03 ± 118,30 975,45 ± 224,45 t4 865,06 ± 148,84 944,48 ± 242,18 t5 849,66 ± 174,93 900,71 ± 219,40 t6 822,97 ± 171,77 875,75 ± 224,55 t7 822,36 ± 165,09 866,52 ± 226,00 t8 908,21 ± 150,29 920,60 ± 264,99 t9 882,20 ± 165,34 920,25 ± 234,97 t10 889,90 ± 167,25 937,54 ± 258,54 t11 889,91 ± 170,58 926,38 ± 236,34 t12 890,06 ± 168,36 924,02 ± 226,39 > 0,05 t13 867,07 ± 148,17 913,08 ± 208,69 t14 849,77 ± 162,05 854,30 ± 186,83 t15 829,49 ± 169,15 857,17 ± 188,83 t16 828,14 ± 168,71 832,64 ± 181,32 t17 831,10 ± 158,80 807,08 ± 153,98 t18 828,20 ± 136,48 814,34 ± 167,42 t19 795,24 ± 157,43 810,81 ± 164,42 t20 789,61 ± 115,80 810,15 ± 193,71 t21 779,70 ± 123,43 807,80 ± 183,93 t22 784,54 ± 115,44 841,30 ± 197,86 t23 795,90 ± 109,15 858,00 ± 176,61 Comment: From t4, SVR values are lower than the original value. Comparing the degree of SVR change from t4 onwards was similar between the two groups
- 13 3.4.3. The SV changes at any research point time SV (ml) 100 90 *p 80 70 60 50 40 30 nhóm P 20 nhóm E 10 0 t 1 t 2 t 3 t 4 t 5 t 6 t 7 t 8 t 9 t 1 0t 1 1t 1 2t 1 3t 1 4t 1 5t 1 6t 1 7t 1 8t 1 9t 2 0t 2 1t 2 2t 2 3 Point time Chart 3.3. The SV changes at any research point time Comment: Group P: SV lowest at t6: 68.57 ± 17.08 ml. Group E: the lowest SV value at t7: 57.60 ± 13.18 ml. From t4 to t23, the SV in group P was always higher than SV in group E, the difference was significant with p
- 14 3.4.5. MAP changes in any research point times HAT B ( m m Hg) 120 nhóm P 100 nhóm E 80 60 40 20 0 t 1 t 2 t 3 t 4 t 5 t 6 t 7 t 8 t 9 t 1 0t 1 1t 1 2t 1 3t 1 4t 1 5t 1 6t 1 7t 1 8t 1 9t 2 0t 2 1t 2 2t 2 3 Thời điểm nghiên cứu Chart 3.5. MAP changes in any research point times Comment: Group P: The MAP is stable throughout the operation. Group E: the lowest MAP at t7: 66.89 ± 15.80 mmHg. 3.5. Mean HR changes in any research point times Table 3.6. Mean HR changes in any research point times Point Group P (𝑋 ± SD); (time/min) Group E (𝑋 ± SD); (time/min) p time (Min-Max) (Min-Max) t1 82,46 ± 6,39 (60-97) 84,76 ± 12,62 (73-100) t2 81,97 ± 6,41 (61-96) 85,34 ± 13,04 (71-89) >0,05 t3 80,67 ± 6,67 (67-98) 86,40 ± 14,49 (74-90) t4 81,00 ± 8,56 (60-109) 100,00 ± 16,46 (73-95) t5 79,77 ± 10,94 (55-107) 101,57 ± 20,40 (63-147) t6 79,34 ± 10,90 (53-110) 101,31 ± 20,55 (61-159) t7 77,26 ± 10,57 (52-109) 102,79 ± 20,92 (53-149) t8 78,36 ± 10,19 (56-96) 104,39 ± 20,42 (62-155)
- 15 t15 77,30 ± 9,24 (56-104) 103,16 ± 16,18 (70-142) t16 78,43 ± 9,68 (56-109) 100,67 ± 15,89 (68-138) t17 77,77 ± 8,08 (59-92) 102,17 ± 16,68 (60-142) t18 77,60 ± 8,26 (61-96) 100,36 ± 15,69 (61-138) t19 77,90 ± 7,58 (63-94) 100,14 ± 15,01 (67-148) t20 77,77 ± 7,37 (64-95) 98,93 ± 15,56 (65-146) t21 77,61 ± 7,10 (64-90) 97,91 ± 15,13 (68-143) t22 77,70 ± 7,03 (65-96) 96,70 ± 15,09 (63-135) t23 77,13 ± 7,20 (62-92) 96,81 ± 15,82 (61-134) 3.6. Undesirable effects 3.6.1. The rate of hypotension, hypertension Table 3.7. The rate of hypotension, hypertension Group P Group E Characteristics p n = 70 n = 70 Hypotension patients numbers 56 (80,0) 63 (90,0) > 0,05 n (%) Reactive hypertension 3 (4,28) 39 (55,7) < 0,05 n (%) Table 3.8. The number of the hypotension in two groups Hypotension Group P Group E p times n (%) n (%) 0 14 (20) 7 (10,0) > 0,05 1 5 (7,14) 26 (37,24) < 0,05 2 26 (37,14) 27 (38,56) 3 10 (14,28) 8 (11,40) 4 9 (12,9) 1 (1,4) > 0,05 5 4 (5,7) 1 (1,4) 6 2 (2,9) 0 Table 3.9. The number of the hypertension in two groups Number of hypertension Group P; n (%) Group E; n (%) 0 67 (95,71%) 31 (44,29%) 1 3 (4,29%) 21 (30%) 2 0 14 (20%) 3 0 3 (4,29%) 4 0 1 (1,42%)
- 16 Table 3.10. The risk of hypotension when taking vasocontrictors Hypotension patients BP normal Risk OR n (%) n (%) Ephedrin 56 (80%) 14 (20%) 0,44 n = 70 Phenylephrin 63 (90%) 7 (10%) 1 n = 70 *OR = 0,44 Comments: The risk of hypotension: ephedrine is 0,44 times less than phenylephrine. Table 3.11. The risk of hypertension when taking vasocontrictors Hypertesion patients BP normal Risk OR n (%) n (%) Ephedrin 28 (40%) 42 (60%) 14,88 n = 70 Phenylephrin 3 (4,3%) 67 (95,7%) 1 n = 70 Comment: The risk of hypertension: ephedrin is 14,88 times more than phenylephrine 3.6.2. Other undesirable effects Table 3.12. Other undesirable effects Group P Group E Characteristics p n = 70 n = 70 Nôn, buồn nôn, n (%) 4 (5,71) 15 (21,43) < 0,05 Tachycardia, n (%) 5 (7,14) 59 (84,28) < 0,05 Bradycardia, n (%) 10 (14,28) 3 (4,23) < 0,05 Patients need to inject atropine, n (%) 10 (14,28) 3 (4,28) < 0,05 Chills, n (%) 4 (5,8) 4 (5,8) Itching, n (%) 1 (1,4) 6 (8,6) > 0,05 Headache, n (%) 0 1 (1,4) Table 3.13. The risk of bradycardia after taking vasocontrictors Bradycardia Normal HR Risk OR n (%) n (%) Phenylephrin 10 (14,28%) 60 (85,72) 3,72 n = 70 Ephedrin 3 (4,23%) 67 (95,77%) 1 n = 70 *OR = 3,72; (95%CI: 0,97-14,16). Comment: The risk of phenylephrin causing bradycardia was 3.72 times higher than ephedrine (95%CI: 0,97-14,16).
- 17 Table 3.14. The risk of tachycardia after taking vasocontrictors Tachycardia Normal HR Risk OR n (%) n (%) Ephedrine 59 (84,28%) 11 (15,72%) 69,72 n = 70 Phenylephrine 5 (7,14%) 65 (92,86) 1 n = 70 *OR = 69,72; (95% CI: 22,8-212,5); p < 0,05. Comment: The risk of ephedrin causing tachycardia was 69.72 times higher than phenylephrin (95%CI = 22,8-212,5); p < 0,05. Table 3.15. The ratio of nausea, vomiting when taking the vasocontrictors Nausea, vomiting Normal Risk OR n (%) n (%) Phenylephrine 5 (7.14%) 65 (92.86%) 0.22 n = 70 Ephedrine 15 (21.42%) 55 (78.58%) 1 n = 70 OR = 0,22 (95%CI = 0,07-0,71). Comment: The risk of nausea, vomiting when taking phenylephrine less than ephedrine is 0.22 (95%CI: 0.07-0.71). 3.7. Indicators related to newborns 3.7.1. Infant characteristics Table 3.16. Infant characteristics in the two groups Group P Group E Characteristics p n = 70 n = 70 Apgar 1 minutes 5 points (n, %) 18 (25,70%) 29 (41,43%) > 0,05 7 points (n, %) 52 (74,29%) 41 (58,57%) Apgar 5 minutes 10 points (n, %) 70 (100%) 70 (100%) Infant weight, kg (𝑋 ± SD) 3,39 ± 0,29 3,47 ± 0,29 > 0,05 (Min-Max) (3,0-4,0) (2,8-4,5) 3.7.2. The results of umbilical cord blood gas Table 3.17. Umbilical cord blood gas results Group P Group E Chracteristics p n = 70 n = 70 Umbilical arterial blood gas pH (𝑋 ± SD) 7,32 ± 0,04 7,25 ± 0,06 < 0,05 (Min-Max) (7,23-7,45) (7,01-7,40)
CÓ THỂ BẠN MUỐN DOWNLOAD

-
Summary of Medical Doctoral thesis: Research on changes of Malondialdehyde content in patients with colon cancer before and after radical surgery
 30 p |
  29
|
29
|  2
2
-
Summary of Medical Doctor of Phylosophy thesis: Study on the effect of 3% sorbitol irrigating solution or 0.9% sodium chloride solution on some test indicators in the transurethral resection of the prostate
 27 p | 25
| 2
27 p | 25
| 2
-
Summary thesis of Medical Doctor: Study on malnutrition status and serum leptin levels in end-stage renal disease patient is on maintenance hemodialysis and outpatients continuous peritoneal dialysis
27 p | 30
| 1


Chịu trách nhiệm nội dung:
Nguyễn Công Hà - Giám đốc Công ty TNHH TÀI LIỆU TRỰC TUYẾN VI NA
LIÊN HỆ
Địa chỉ: P402, 54A Nơ Trang Long, Phường 14, Q.Bình Thạnh, TP.HCM
Hotline: 093 303 0098
Email: support@tailieu.vn
Giấy phép Mạng Xã Hội số: 670/GP-BTTTT cấp ngày 30/11/2015 Copyright © 2022-2032 TaiLieu.VN. All rights reserved.

