


Obesity
lượt xem 1
download
 Download
Vui lòng tải xuống để xem tài liệu đầy đủ
Download
Vui lòng tải xuống để xem tài liệu đầy đủ
Document "Obesity" presentation of content: General aspects, management of obesity, obesity in the elderly, cascades, stakeholders and management options, management options relative to available resources, pharmacotherapy, lifestyle changes, surgery, obesity and the elderly.
Bình luận(0) Đăng nhập để gửi bình luận!
Nội dung Text: Obesity
- WGO Global Guideline Obesity (full version) 1 World Gastroenterology Organisation Global Guideline Obesity Review team: Lisbeth Mathus-Vliegen (co-chair) (The Netherlands) James Toouli (co-chair) (Australia) Michael Fried (Switzerland) Aamir Ghafoor Khan (Pakistan) James Garisch (South Africa) Richard Hunt (Canada) Suleiman Fedail (Sudan) Davor Štimac (Croatia) Ton Lemair (Netherlands) Justus Krabshuis (France) External experts: Pedro Kaufmann (Uruguay) Eve Roberts (Canada) Gabriele Riccardi (Italy) Contents 1 General aspects 2 Management of obesity 3 Obesity in the elderly 4 Cascades 5 Appendices and evidence © World Gastroenterology Organisation, 2011
- WGO Global Guideline Obesity (full version) 2 1 General aspects 1.1 Definitions • Body mass index (BMI): weight (in kilograms) divided by the square of the individual’s height (in meters). • The International Obesity Task Force (IOTF) definition of obesity (based on Caucasians with a “Western” lifestyle) sets cut-off points of 25 kg/m2 for adult excess weight and 30 kg/m2 for obesity. These BMI cut-off points are considered to have a more international basis than other definitions. • The BMI index ranges for children and teenagers should take the normal differences in body fat between boys and girls and differences in body fat at various ages into account: U.S. Centers for Disease Control and Prevention (CDC) definition: — BMI ≥ 95th percentile for age = “overweight” — BMI between the 85th and 95th percentiles = “at risk of overweight” European Childhood Obesity Group classification: — BMI ≥ 85th percentile for age = “overweight” — BMI ≥ 95th percentile for age = “obesity” 1.2 Key management points • Diet and lifestyle modification, with or without medications, is the first step; if this fails, then surgery should be considered. • The first treatment step is the basis for every subsequent step and consists of a diet, a less sedentary lifestyle, exercise, and behavioral modification. If weight loss of 5–10% is not achieved within 6 months, the next step is the same basic treatment combined with medication. The last step is again a diet, a less sedentary lifestyle, exercise, and behavioral modification, but now combined with bariatric surgery. • Obesity requires long-term care, and it is important that management should be provided in a multidisciplinary environment with support from physicians, medical specialists (internists), dieticians, surgeons, psychologists and physiotherapists. • Providing education and information for children may be the best and least costly way of controlling obesity in the longer term. 1.3 The global picture The maps below show the percentages of adults and children with obesity worldwide. The statistics for each country can be viewed by visiting the International Association for the Study of Obesity’s web site (http://www.iaso.org/publications/world-map- obesity/) and holding the mouse cursor over any country. © World Gastroenterology Organisation, 2011
- WGO Global Guideline Obesity (full version) 3 1.3.1 Epidemiology Table 1 Global epidemiology, 2005–2015 2015 The World Health Organization (WHO) projects that by 2015, approximately 2.3 billion adults will be overweight and more than 700 million will be obese. 2008 A report in the Journal of the American Medical Association (JAMA) shows that overall, in 2003–2006: • 11.3% of children and adolescents aged 2–19 years were at or above the 97th percentile of the 2000 BMI-for-age growth charts (extreme obesity). © World Gastroenterology Organisation, 2011
- WGO Global Guideline Obesity (full version) 4 • 16.3% were at or above the 95th percentile (obese). • 31.9% were at or above the 85th percentile (overweight). • Prevalence estimates varied by age and by ethnic group. • Analyses of the trends in high BMI for age showed no statistically significant trend over four periods studied (1999–2000, 2001–2002, 2003–2004, and 2005–2006), for either boys or girls. Today, the mean BMI has increased and the most obese individuals have become much more obese, so that the curve of the normal distribution has shifted to the right. 2005 • WHO data show that in 2005, approximately 1.6 billion adults (aged 15 or over) were overweight and that at least 400 million adults were obese. • At least 20 million children under the age of 5 years were overweight globally in 2005. • Obesity has become an epidemic condition. • In the United States, obesity among adults increased from 15.3% in 1995 to 23.9% in 2005. 1.3.2 Prevalence of obesity in the elderly The prevalence of obesity is rising progressively, even among older age groups. On the basis of the National Health Examination Survey (NHES) I and National Health and Nutrition Examination Study (NHANES) I–III, it was estimated that the prevalence of obesity (BMI ≥ 30 kg/m2) in elderly Americans aged 60 or over would increase from 23.6% in 1990 and 32.0% in 2000 to 37.4% in 2010 (ranging from 33.6% in the best-case estimate, based on the lowest increase in prevalence of 0.1%, to 39.6% in the worst-case estimate, based on continuation of the present increase of 7%). This signifies an increase in the number of obese older adults from 9.9 million (1990) and 14.6 million (2000) to 20.9 million in 2010 (range 18.0–22.2 million). It is at present unclear whether these projections will be borne out. The prevalence of obesity in nursing homes is also an escalating problem. Almost 30% of U.S. nursing homes have reported that 15–20% of their residents are obese. Evidence suggests that obesity and weight gain increase the relative risk of nursing- home admission for community-dwelling older adults. For those aged 65–74, the risk of admission increased by 31%. Those who were overweight and experienced a significant weight gain were 2.13 times more likely to be admitted to a nursing home. In Europe, the prevalence of obesity increases with age to a peak at about 60 years. Thereafter, body weights change little and begin to decline in older age groups. However, current long-term trends indicate that the prevalence of obesity will increase. © World Gastroenterology Organisation, 2011
- WGO Global Guideline Obesity (full version) 5 Fig. 1 Body mass index (BMI) data by country: percentages of adults with a normal BMI 1.3.3 A problem in developing countries? Once considered a problem only in high-income countries, excess weight and obesity are now dramatically increasing in low-income and middle-income countries as well, particularly in urban settings, according to the World Health Organization (WHO). In developing countries, the prevalence of chronic or noncommunicable diseases (such as hypertension, diabetes, and cardiovascular disease) is rising much more rapidly than in the industrialized world. Although the problem of childhood malnutrition is far from having been solved, the new pandemic of obesity and its accompanying noncommunicable diseases are challenging organizations such as the WHO. Although it is now well recognized that chronic diseases are a growing problem for low-income and middle-income countries, limited data are available for these countries and the developing world has been largely ignored in health strategies. In a recent systematic review, the highest prevalences of childhood excess weight were found in Eastern Europe and the Middle East, while India and Sri Lanka had the lowest prevalence. Studies in developing countries showed a considerable prevalence of metabolic syndrome in adolescents. Developing countries are facing an increasing incidence of childhood obesity and new cases of metabolic syndrome among children. In the near future, this is likely to create a huge socioeconomic and public health burden for poorer nations. The WHO has warned that projected numbers of new cases of diabetes may run into the hundreds of millions within the next two decades. The globalization process may exacerbate the uneven dietary development between rich and poor: while high-income groups in developing countries enjoy the benefits of a more dynamic marketplace, lower-income groups may experience convergence towards poor-quality diets. Many developing countries are in a “nutrition transition” © World Gastroenterology Organisation, 2011
- WGO Global Guideline Obesity (full version) 6 phase, evident in the rapid rise in obesity and diet-related chronic diseases throughout the world. Although developing countries are still struggling with malnutrition and micronutrient deficiencies, the consumption of foods high in fats and sugars in these countries is increasing. This transition is rooted in the globalization processes that are affecting the nature of agricultural and food systems and altering the quantity, type, cost, and desirability of foods available for consumption. The integration of the global marketplace is affecting specific diet patterns, especially in middle-income countries, as a result of: • Greater consumption of vegetable oil, made possible by agricultural production and trade policies • Greater consumption of highly processed foods, facilitated by policies on foreign direct investment and global food marketing Some of the structural causes of obesity and diet-related chronic diseases throughout the world can be addressed through global food and health policies—especially in groups with low socioeconomic status. According to the WHO, many low-income and middle-income countries are now facing a “double burden” of disease: • While still dealing with infectious diseases and undernutrition, they are at the same time facing a rapid upsurge in chronic disease risk factors such as obesity and excess weight. • Undernutrition and obesity can now be found existing side by side within the same country, the same community, and even within the same household. • This double burden is caused by inadequate nutrition in the prenatal period and in infants and young children, followed by exposure to high-fat, energy-dense, micronutrient-poor foods and a lack of physical activity. 2 Management 2.1 Management of obesity • Ensure optimal medical care for patients who are obese: — Educate staff about treating patients with respect. — Offer obese patients the same level of care as nonobese patients, providing general preventive services and monitoring and treating ongoing medical conditions. • Encourage healthy behavior and self-acceptance, even in the absence of weight loss: — Record weight without comments. — Ask patients if they wish to discuss their weight or health. — Review barriers among health-care providers—e.g., the perception that obesity is mainly due to the patient’s lack of willpower. • Determine the obesity class—the level of excess weight: — Assess overall fatness and central adiposity. — Calculate BMI and measure waist circumference. • Assess comorbidities and risk status. • Is weight loss indicated? — Prevent (further) weight gain. © World Gastroenterology Organisation, 2011
- WGO Global Guideline Obesity (full version) 7 — Prevent the complications of obesity. — The goal is to favorably influence coexisting conditions associated with obesity by reducing excess weight, maintaining a lower body weight, and controlling associated risk factors. — What is the recommended minimum weight loss? — Assess the patient’s expectations. • Evaluation of the patient’s readiness: — Reasons and motivation for weight loss. — Previous attempts at weight loss. — Support expected from family and friends. — Understanding of risks and benefits. — Attitudes toward physical activity. — Time availability. — Potential barriers to the patient’s adoption of change. — Discuss the patient’s preferences regarding diet and physical activity. • Decide which treatment or combination of treatments is best: — Which diet should be recommended? — Discuss a physical activity goal. • Is the patient a candidate for surgery? — BMI of 40 or higher. — BMI of 35 or higher, with comorbidities. — Severe sleep apnea. — Obesity-related cardiomyopathy. — Severe diabetes mellitus. — Severe joint disease. — Failure of medical weight control. Patients should have made previous attempts to lose weight. — Absence of medical or psychological contraindications. — No risks, or acceptable risks, for surgery. — The patient should receive full information about the anticipated risks and results of the operation, understand the procedure and its risks, and be strongly motivated to comply with the postsurgical regimen. — Medical and surgical care should be provided by a multispecialty team with experience in bariatric surgery and in perioperative and follow-up care. Note: Different countries use different BMI levels as indications for surgery: in the United States, the levels are 35 and 30; in continental Europe, the figures are 40 and 35. The United Kingdom guideline published by the National Institute for Health and Clinical Excellence (NICE) is very conservative, with a BMI > 50 required for surgery. • Consider Orlistat weight-loss medication: — Combine with daily multivitamin treatment (due to possible malabsorption of fat-soluble vitamins). Inform the patient about side effects. There are two forms: Orlistat 3 × 120 mg (Xenical or Zerucal) or 3 × 60 mg daily. • Manage coexisting conditions: — Hypertension: lower elevated blood pressure. — Type 2 diabetes: lower elevated blood glucose levels • Dyslipidemia: — Lower elevated levels of total cholesterol, low-density lipoprotein (LDL) cholesterol, and triglycerides. © World Gastroenterology Organisation, 2011
- WGO Global Guideline Obesity (full version) 8 — Raise low levels of high-density lipoprotein (HDL) cholesterol by encouraging physical exercise. • Discuss strategies for weight maintenance. • Encourage the patient to set realistic goals. • Record keeping has been shown to be one of the most successful behavioral techniques for weight loss and maintenance. The patient should: — Record food intake and energy expenditure. — Keep track of body weight (at least once a week). • Use fat-reduced, fiber-enriched diets. Consider adding protein-rich and low glycemic index diets for weight maintenance. • Expand physical activity in line with the current fitness level and obesity- associated conditions: — Walking — Joining a gym — Developing a home-based program of aerobic and resistance training. 2.2 Treatment outcome General. A 5–10% reduction in weight may be sufficient for favorable modification of waist circumference, blood pressure, circulating cytokines, and (variably) fasting levels of glucose, triglycerides, and HDL cholesterol. This applies to individuals with a BMI of up to 40 and has been confirmed by many studies. At BMI levels above 40, a 20–25% weight loss is recommended, although without much evidence. • A change in the treatment regimen should be considered if weight loss is less than 5% in the first 6 months. • Willingness to achieve weight reduction is important in predicting success. Lifestyle intervention. Studies have shown that in comparison with standard care, lifestyle intervention: • Significantly reduces body weight and cardiovascular risk factors. • Has favorable effects, which are maintained for up to 3 years. Physical activity without a reduced calorie intake leads to limited weight loss results. Treatment combinations. Dietary and lifestyle interventions, along with pharmacologic weight loss treatment, provide modest weight loss and may improve markers of cardiovascular risk factors, although these benefits occur mainly in patients with cardiovascular risks. 2.3 Maintenance of weight reduction The body has multiple mechanisms for modifying the energy balance to reestablish the original body weight. Weight loss induces a reduction in energy expenditure, hindering maintenance of weight loss. Failure to maintain weight loss is a common problem. While short-term weight loss depends on caloric restriction, maintenance of weight loss mostly depends on the level of physical activity. For most people, long-term success is still difficult to achieve, and current therapies for obesity do not provide sufficient support for patients in adhering to the required lifestyle changes. © World Gastroenterology Organisation, 2011
- WGO Global Guideline Obesity (full version) 9 Predictive factors for maintaining weight loss include: • Eating a low-fat, fiber-enriched, protein-rich diet. • Frequent self-monitoring of body weight and food intake. • High levels of physical activity. • Long-term patient–provider contact. • An initial greater weight loss during the active weight loss phase predicts a better weight maintenance thereafter. • Weight loss of more than 2 kg in 4 weeks. • Frequent/regular attendance at a weight loss program. • Patient’s belief that body weight can be controlled. • Behavioral interventions (may be helpful). Protective factors against regaining weight: expending about 2500 kcal/week, through: • Moderate activity for approximately 80 min/day (brisk walking) • Or vigorous activity for 35 min/day (jogging) Treatment and support options: • Primary-care setting • Commercial programs • Internet-based weight maintenance programs 2.4 Risks of weight loss Some studies have concluded that intentional weight loss reduces mortality, whereas unintentional weight loss is associated with an increased risk of mortality. Due to an increased flux of cholesterol through the biliary system, weight loss may increase the chances of cholelithiasis developing. Diets with moderate amounts of fat that trigger gallbladder contraction may reduce this risk. Slow weight loss—e.g., 0.5– 1.0 kg/week—has been shown to prevent the formation of gallstones in patients with higher weight loss rates. Weight loss with adjustable gastric bands is associated with an incidence of gallstone formation that is no different from that in the normal population. 3 Obesity in the elderly 3.1 Introduction There has been a rapid and continuing increase in life expectancy in most countries. By the year 2030, 20% of the adult U.S. population will be over the age of 65 and in Europe roughly two active people (aged 15–65) will be caring for one inactive older person. This increase in life expectancy has not necessarily meant an increase in healthy life years, but rather extra years of illness risk. This, together with the epidemic of obesity, which is showing an upward shift into older age groups, signifies a double disease burden in the near future. A detailed discussion of the available evidence on obesity and the elderly is available in the hyperlinked Appendix 5 below. © World Gastroenterology Organisation, 2011
- WGO Global Guideline Obesity (full version) 10 3.2 Health consequences of obesity in the elderly It is far from clear which parameter may best predict poor health and a poor outcome with obesity in the elderly. A slightly higher BMI value associated with a lower relative mortality in older compared with younger adults does not mean that obesity is not as harmful in the elderly. BMI may be a less appropriate index in the elderly. It should also be realized that although the relative risk of mortality and decreased survival appear to decline at ages above 59, the absolute mortality risk increases with increasing BMI up to age 75. There are many confounding factors that contribute to underestimation of the health risks of obesity in the elderly. Among these are the survival effect (the presence of “resistant” survivors in whom the relation between BMI and mortality is lost), competing mortalities, relatively shortened life expectancy in old age, and the importance of age of onset and duration of obesity, as those who have become obese in old age may die before the adverse effects of obesity become apparent. In addition, smoking, weight change (weight gain and weight loss may be more detrimental than a stable weight) and unintentional weight loss may confound the estimation of health risks. Medical complications of obesity in the elderly are mainly associated with metabolic syndrome (with glucose intolerance, hypertension, dyslipidemia, and cardiovascular disease). Metabolic syndrome peaks at age 50–70 in males and age 60–80 in females, with an odds ratio (OR) of 5.8 in 65-year-old males and 4.9 in 65- year-old females in comparison with 20–34-year-old individuals. Other obesity-related disorders are (osteo)arthritis (with an OR of 4.8 for males and 4.0 for females), pulmonary dysfunction including obesity hypoventilation syndrome, obstructive sleep apnea syndrome, cancer, and urinary incontinence. The obese elderly may also have to deal with functional limitations due to decreased muscle mass and strength and increased joint dysfunction, disabilities of (instrumental) activities of daily living, frailty, and an impaired quality of life. Obesity is a major cause of frailty (OR 3.5 in 70–79-year-olds). There are also beneficial effects of obesity, such as a higher bone mineral density and a lower risk of osteoporosis and hip fractures, with an extra cushioning effect of fat around the trochanter that may provide protection against hip fracture during a fall. 3.3 Treatment options in the elderly A variety of treatment options are available. Whether they are indicated in combination or singly depends on a variety of factors, including risk, patient preferences, and available resources. • Lifestyle interventions, involving diet, physical activity, and behavioral modification • Pharmacotherapy • Surgery © World Gastroenterology Organisation, 2011
- WGO Global Guideline Obesity (full version) 11 3.3.1 Lifestyle interventions Lifestyle interventions should consist of a 500–1000 kcal deficit diet with a sufficient amount of high-quality protein (1.0 g/kg) and adequate supplementation of calcium (1000 mg/d) and vitamin D (10–20 µg/d), as well as multivitamin and mineral supplements, combined with exercise and behavioral therapy. Increased physical activity and regular exercise are not essential for achieving initial weight loss, but can help in maintaining weight loss and preventing weight from being regained. Behavioral therapy includes self-monitoring, goal setting, social support, stimulus control, and relapse prevention. Changes in the lifestyle of older persons present special challenges. An increased burden of disease, adverse quality of life, cognitive dysfunction and depression, isolation, loneliness, widowhood, dependency on others, and institutionalization may make it difficult to change the lifestyle. Chronic disability and reduced physical and exercise capacity may interfere with the desired increase in physical activity. Obstacles such as impaired vision and hearing and limited financial resources are also faced by older adults. The combination of a moderate energy-deficit diet, increased physical activity, and behavioral modification leads to a moderate weight loss of 0.4–0.9 kg/week or 8–10% in 6 months, with improvements in obesity-related medical complications and physical dysfunction, and is associated with a low risk of treatment-induced complications. The efficacy of lifestyle interventions has to be assessed in studies including only elderly individuals or a large proportion of them. Systematic reviews of weight-loss interventions in people aged over 60 have shown significant changes, such as improved glucose tolerance and physical functioning, a reduced incidence of newly developed diabetes, and significant benefits for those with osteoarthritis, diabetes, and coronary heart disease. One negative effect observed was a slight decrease in bone mineral density and lean body mass. Research has tended to focus too much on cardiovascular risks and not enough on the multiple effects of obesity on mobility, bladder function, sexual health, mood, and quality of life, which determine the quality of everyday life for elderly individuals. 3.3.2 Pharmacotherapy Of the many drugs that have been developed to treat obesity, most have now been withdrawn from the market and only orlistat is currently approved for longer periods of administration in patients with a BMI ≥ 30 kg/m2 and in patients with a BMI of 27– 29.9 kg/m2 in the presence of obesity-related comorbidity. Orlistat, a lipase inhibitor, blocks the digestion and absorption of fat by up to one- third of the ingested amount, thereby causing an energy deficit of approximately 300 kcal/d. Weight loss with orlistat is 2–3 kg more than with a placebo and results in improved glucose tolerance and blood pressure, depending on the rate of weight loss. © World Gastroenterology Organisation, 2011
- WGO Global Guideline Obesity (full version) 12 In addition, orlistat has beneficial effects on dyslipidemia that are independent of weight loss. Gastrointestinal side effects include flatulence, fecal incontinence, oily spotting, urge, steatorrhea, and abdominal cramps. These occur if high-fat meals (> 20 g fat/meal) are consumed. Absorption of fat-soluble vitamins is reduced with orlistat, but values never fall into the deficiency range. When fat-soluble vitamins such as vitamin D are supplied, they should be ingested 2 hours before ingestion of orlistat. More liquid stools may be beneficial for many elderly people who suffer from constipation, but it may also result in fecal incontinence, with impaired internal and external sphincter function. An analysis of an older subpopulation in a 2-year randomized study in a primary care setting found that orlistat was just as effective in adults aged 65 or over as in younger adults. Gastrointestinal side effects also did not differ between older and younger patients. 3.3.3 Bariatric surgery Bariatric surgery is indicated for individuals with severe obesity—i.e., with a BMI ≥ 40 kg/m2 or a BMI ≥ 35 kg/m2 with comorbidity. There are at present no guidelines for bariatric surgery in the elderly, but those who consider including the elderly have suggested that the values used in younger adults should be continued. Recent research shows that older obese adults suffer from more comorbidity and require more medication before surgery than younger obese individuals. A significant loss of excess weight of 60% after 1 year and 50% after 5 years is observed after open or laparoscopic gastric bypass. This weight loss is associated with an improvement in obesity-related comorbidity and an overall reduction in medication requirements. None of the published studies has provided any data on the number of patients in whom surgeons declined to perform the operation due to major life-limiting processes or unacceptable cardiorespiratory risk factors, or because the surgical risks outweighed the expected benefits. Most of the patients included in research studies have been women, and a very recent study in veterans has shown that sex difference is a factor that should be taken into account when assessing risk. No survival benefit was observed during a mean follow-up period of 6.7 years in obese older men with obesity-related comorbidity. This might in part be explained by the shortness of the follow-up period, but it might also be related to the fact that bariatric surgery appears to be more difficult in severely obese male patients. 3.3.4 Nutrition aspects Diet-induced weight loss results in a decrease in both fat mass and fat-free mass, with approximately 75% of the weight loss being composed of fat tissue and approximately 25% of fat-free mass. Weight loss in older persons may therefore exacerbate the age- related loss of muscle mass and further impair physical function. On the basis of intensive research on sarcopenia (age-related reduction in skeletal muscle mass in the elderly) and sarcopenic obesity, dietary guidelines have been adjusted to prevent sarcopenic obesity and to guide the medical profession in supporting weight loss in the presence of sarcopenic obesity. Proteins and amino acids are constantly turned over in healthy muscle, with an equilibrium between protein synthesis and protein breakdown. Sarcopenia may be the © World Gastroenterology Organisation, 2011
- WGO Global Guideline Obesity (full version) 13 result of increased rates of protein breakdown under the influence of cytokines produced in adipose tissue in a chronic state of low-grade inflammation. It may also be an effect of diminished protein synthesis, which is partly due to the anorexia of aging. Early satiety secondary to decreased relaxation of the fundus of the stomach, increased cholecystokinin release in response to fat intake, and increased leptin levels and declining testosterone levels in men may account for decreased food and nutrient intake. Treating obesity requires creating an energy deficit, and in individuals with sarcopenic obesity, or who are at risk of developing it, the energy deficit to be established is more moderate than usual (500 kcal, with a range of 200–750 kcal), with the emphasis on a higher intake of proteins of high biological quality. When the energy intake is restricted, protein intake has to be maintained or increased, as dietary protein and amino acids are the most effective means of slowing or preventing muscle protein catabolism. There is no evidence that co-ingestion of protein and fat affects protein anabolism. Aging in itself thus does not reduce the anabolic response to adequate quantities of high-quality protein; instead, it is the presence of carbohydrates that blunts this response, explained by the effects of insulin resistance on muscle protein synthesis. A carbohydrate intake of less than 150 g/day is therefore advised. A modest bout of physical activity such as 45 minutes of treadmill walking restores the ability of insulin to stimulate protein synthesis. Protein intake should also be strategically timed in such a way as to overcome other consequences of aging, such as blunting of the anabolic response due to changes in digestion, gastric emptying rate, splanchnic uptake, and peripheral utilization. In addition, in contrast to younger people, skeletal muscle in older individuals is not able to respond to low doses of protein and amino acids (7 g), but 10–15 g of amino acids are capable of stimulating protein synthesis to a similar extent as in the young. Other potential strategies for enhancing protein synthesis are including leucine in the diet, from a minimum requirement of 2 g/day to an optimum of 6–8 g/day. Leucine-rich foods include legumes (soy beans) and animal products (fish, beef). Leucine increases protein anabolism and decreases protein breakdown. Adding leucine to a mixed nutrient meal in older individuals resulted in a 56% increase in muscle protein synthesis. 3.3.5 Physical exercise programs The American College of Sports Medicine recommends a multi-component training exercise program (strength, endurance, balance, and flexibility) to improve and maintain physical function in older adults. Resistance training has been investigated as an approach to counteract sarcopenia in older adults by stimulating protein synthesis and causing muscle hypertrophy, with increased muscle mass and muscle strength and with improved physical functioning and performance of both simple and complex activities. © World Gastroenterology Organisation, 2011
- WGO Global Guideline Obesity (full version) 14 The fear that endurance and resistance training might interfere with each other negatively has not been substantiated in recent research, and a combination of progressive resistance training and aerobic exercise is the optimal exercise strategy for simultaneous improvement of insulin resistance and functional limitations in the elderly. Aerobic exercise is a second-best choice. 3.3.6 Barriers and perceived constraints on participation in physical exercise programs The Screening and Counseling for Physical Activity and Mobility in Older People (SCAMOP) study included 619 patients aged 75–83, with BMI levels between 20 and 53 kg/m2. The objective was to examine what the patients regarded as constraints on exercise and whether these perceived constraints explained the increased risk of physical inactivity. In comparison with the nonobese elderly (BMI 20–29.9 kg/m2), the moderately obese (BMI 30–34.9 kg/m2) had twice the risk of inactivity, and the severely obese (BMI ≥ 35 kg/m2) had four times the risk of inactivity. Poor health, pain, diseases, and tiredness explained 27% of the increased risk of physical inactivity. Fears and negative experiences, such as fear of falling, fear of injury, exercise experienced as being uncomfortable, and insecurity when exercising outdoors, contributed 23% to the increased risk of inactivity. In the model, all of these factors, together with a general lack of interest in exercise, explained 42% of the increased risk of physical inactivity, leaving 58% unexplained. These factors were substantially more frequent among the severely obese. A meta-analysis of 43 studies in 33,090 60–70-year-olds rejected the hypothesis that interventions to increase physical activity do not affect activity among older adults. Several modulating factors were found that can be used to increase physical activity in the elderly. Only physical activity should be targeted, and it should not be coupled with health education. The focus should also be on group activity, encouraging moderate exercise intensity and activity, incorporating self-monitoring, and encouraging center-based activities involving intense contact with the intervention staff at structured times. 4 Cascades 4.1 Stakeholders and management options Which of the approaches to obesity treatment or prevention listed in Table 2 below is resource-dependent? All stakeholders need to take action at global, regional, and local levels. Excess weight and obesity, as well as the related chronic diseases, are largely preventable. Individual level. The patient should avoid energy-dense foods, limit the intake of alcohol, remember the nonsatiating effects of foods rich in calories such as fat and alcohol (alcohol having an additional disinhibitory effect on eating), and bear in mind the better satiation and satiety effects of proteins followed by complex carbohydrates. • Achieve energy balance and a healthy weight. • Limit energy intake from total fats and shift fat consumption away from saturated fats to unsaturated fats. © World Gastroenterology Organisation, 2011
- WGO Global Guideline Obesity (full version) 15 • Increase consumption of fruit and vegetables, as well as legumes and whole grains. • Limit the intake of sugars (particularly in beverages). • Increase physical activity. Governments, international partners, civil society and nongovernmental organizations, and the private sector should: • Shape healthy environments. • Make healthier diet options affordable and easily accessible. • Facilitate and promote physical exercise. The food industry should: • Reduce the fat and sugar content of processed foods and also the portion sizes. • Increasingly introduce innovative, healthy, and nutritious choices (low energy density, fiber-rich, functional foods). • Review current marketing practices to accelerate health gains throughout the world. Table 2 Decision scheme for weight-loss treatment Obesity level Grade 1 Grade 2 Grade 3 Western countries BMI 25.0–26.9 27.0–29.9 30.0–34.9 35.0–39.9 ≥ 40 Waist (cm) Male 94–102 94–102 ≥ 102 ≥ 102 Female 80–88 80–88 ≥ 88 ≥ 88 Eastern/Asian countries* BMI 23.0–24.9 25.0–29.9 30.0–34.9 ≥ 35 ≥ 35 Waist (cm) Male < 90 < 90 ≥ 90 ≥ 90 Female < 80 < 80 ≥ 80 ≥80 Treatment options No comorbidity Diet Diet Diet Pharmaco- Surgery‡ if therapy† supervised diets with or Exercise Exercise Exercise Supervised without diets pharmaco- Behavioral If these fail: therapy† fail therapy surgery‡ Pharmaco- therapy† ¶ Comorbidity Diet Diet Diet Pharmaco- Surgery‡ if present therapy† supervised diets with or Exercise Exercise Exercise Supervised without © World Gastroenterology Organisation, 2011
- WGO Global Guideline Obesity (full version) 16 Obesity level Grade 1 Grade 2 Grade 3 diets pharmaco- ‡§ therapy† fail Behavioral Behavioral Behavioral Surgery therapy therapy therapy Pharmaco- therapy† § BMI, body mass index; F, female; M, male. Source: Adapted from guidelines from the U.S. National Heart, Lung, and Blood Institute. * Asians are at greater risk, and decisions are taken one step earlier in these patients. † Only in patients with obesity-related disease who are unable to achieve adequate weight loss with available conventional lifestyle modifications and have no absolute contraindications for drug therapy. ‡ Only in patients with obesity-related disease who are unable to lose weight with available conventional therapy and have no absolute contraindications for surgery. ¶ While there is no evidence for surgery in patients with BMI 30–35 and no complications, exceptions are possible when there is significant comorbidity. § There is evidence for surgery in patients with BMI 35-40 and comorbidities; according to experts, the cut-off point is likely to be lowered to 30 during the next few years. But this may differ between different countries. 4.2 Management options relative to available resources Table 3 Management cascade relative to available resources Management options by BMI Resources 25–30 30–35 35–40 > 40 High/affluent DEB DEB + M DEB DEB M + SD SD + surgery ± Surgery ± Surgery ± Surgery Medium/normal DEB DEB DEB DEB SD SD ± surgery Low/absent DEB DEB DEB DEB ± surgery DEB, diet, exercise, and behavior change (must be supervised); M, medication—only effective in case of moderate increase in BMI (must be supervised); SD, strictly supervised diets. Notes: 1. Whatever treatment is given, diet, exercise, and behavioral changes should always be prescribed. 2. “± Surgery” is added to indicate that if the other strategies fail, then this is an option. Even in low-resourced countries, surgery is an option if obesity needs to be addressed. An open gastric bypass is not an expensive operation. © World Gastroenterology Organisation, 2011
- WGO Global Guideline Obesity (full version) 17 Table 4 Diet: cascade relative to the resources available Resources Diet types There should always be an energy restriction of at least 600 kcal below everyday needs, which is in practice even more restricted than the 600 kcal (since to maintain 1 kg in body weight, 20–25 kcal is needed, so that someone weighing 120 kg needs to eat at least 2400 kcal in order not to slim) High/affluent High-protein diets Low-carbohydrate diets Medium/normal High-fiber diets Low glycemic index diets Low/absent No energy-dense foods Reduced-fat diets N.B.: The costs of the diet differ in countries in which fruits and vegetables are plentiful but meat is more expensive, and the reverse may be true elsewhere. It is of course difficult to emphasize energy restriction or reduction first, before discussing in detail the changes in macronutrients and diet composition. Table 5 Surgery: cascade relative to the resources available Resources available Surgical procedure High Biliopancreatic diversion with duodenal switch Normal Laparoscopic gastric bypass Adjustable gastric band Sleeve gastrectomy Low Open gastric bypass; in severe obesity, a long-limb gastric bypass Vertical banded gastroplasty Sleeve gastrectomy Gastric band 5 Appendices and evidence Click on one of the hyperlinks below for a more detailed discussion and evidence: • Appendix I: Nutrition and diet • Appendix 11: Pharmacotherapy • Appendix III: Lifestyle changes • Appendix IV: Surgery • Appendix V: Obesity and the elderly © World Gastroenterology Organisation, 2011
- WGO Global Guideline Obesity (Appendix 1) 1 World Gastroenterology Organisation Global Guideline Obesity Appendix 1: Nutrition and diet Review team: James Toouli (chair) (Australia) Michael Fried (Switzerland) Aamir Ghafoor Khan (Pakistan) James Garisch (South Africa) Richard Hunt (Canada) Suleiman Fedail (Sudan) Davor Štimac (Croatia) Ton Lemair (Netherlands) Justus Krabshuis (France) Special advisor: Elisabeth Mathus-Vliegen (The Netherlands) External experts: Pedro Kaufmann (Uruguay) Eve Roberts (Canada) Gabriele Riccardi (Italy) © World Gastroenterology Organisation, 2011
- WGO Global Guideline Obesity (Appendix 1) 2 Appendix 1: Nutrition and diet Diets A recent meta-analysis summarized current outcomes (Table I). Table I Meta-analysis of diets in maintenance of weight loss: 29 studies with a follow-up period of at least 2 years Weight Follow-up Studies Weight loss WLM WLM reduction (y) (n) (kg) (kg) (%) (% ) All 4.5 13 14.0 3.0 23.4 3.15 Men 4.4 5 18.3 4.7 30.5 4.48 Women 4.4 6 16.6 4.66 23.6 4.67 VLCD 4.5 4 24.1 7.05 29.4 6.59 HBD 4.5 8 8.8 1.99 17.8 2.11 Lower exercise 2.7 6 22.0 7.47 27.2 6.66 Higher exercise 2.7 6 20.9 14.99 53.8 12.49 HBD, hypoenergetic balanced diet; VLCD, very low-calorie diet; WLM, weight loss maintenance. Source: Anderson et al., American Journal of Clinical Nutrition 2001;73:579–83. The long-term efficacy of diets requires further study; currently available results are listed in Table II. Table II Long-term efficacy of diets in 17 studies including 3030 patients, with a follow-up period of at least 3 years and an attrition rate of less than 50%—median follow-up 5 y (range 3–14 y) in 2131 patients (70%) and with maintenance of all weight loss or at least 9–11 kg of initial weight loss Range Initial weight loss (median) 11 kg 4–28 kg Successful weight maintenance 15% 0–49% Influence of initial treatment Diet + group therapy 27% 14–31% Diet alone 15% 6–28% Diet + behavioral therapy 14% 0–49% Influence of energy level of initial diet VLCD (300–600 kcal) 14% 6–49% Conventional diet (800–1800 kcal) 18% 0–31% Influence of intensity of follow–up Active approach 19% 13–49% © World Gastroenterology Organisation, 2011
- WGO Global Guideline Obesity (Appendix 1) 3 Range Passive approach 10% 0–31% VLCD + behavioral therapy + active follow-up 38% 27–49% VLCD, very low-calorie diet. Source: Ayyard and Anderson, Obesity Review 2000;1:113–9. The minimum energy required by a normal-weight adult who stays in bed is approximately 0.8 kcal/min (1150 kcal/day). • This maintains body temperature, function of the heart and other organs, and tissue repair. • High levels of physical activity can increase energy expenditure 4–8-fold. • As a guideline, a normal adult needs approximately 22–25 kcal/kg nutrient intake to maintain 1 kg of body weight. For weight loss to occur, energy intake must be less than energy expenditure. • Predicted weight loss: 0.5–1.0 kg/week, based on a calorie deficit of 500– 1000 kcal/day with no changes in physical activity. • In general, diets < 800 kcal/day are not recommended. Reduced-calorie diets include those specifying caloric intakes: • Very low (less than 800 kcal/day) — To be used only when more rapid weight loss is needed — Medical monitoring is necessary • Low (800–1500 kcal/day) • Moderate (about 500 kcal less than typical daily intake) • Lowering energy intake either by reducing the appetite or by lowering the energy density of the foods eaten is able to facilitate body weight reduction—more controlled intervention trials are needed to assess whether the effects on body weight are also sustained in the longer term. Low-fat diets Low-fat diets are still controversial, although epidemiologic and ecologic data have indicated an association between reduced fat intake and stabilizing or lower body weight. • Low-fat diets: < 30% of total calories from fat • Very-low-fat diet: restrict dietary fats to < 15% of total calories, 15% of calories from protein and 70% from carbohydrates; hard to maintain in the long term Low-carbohydrate diets These show better 6-month results than with low-fat diets, but the differences are no longer significant at 12 months. • < 60 g of carbohydrates daily. • Many diets (such as the Atkins and South Beach diets) start with < 20 g of carbohydrates daily and gradually increase the quantity. © World Gastroenterology Organisation, 2011
CÓ THỂ BẠN MUỐN DOWNLOAD
-

CLINICAL PHARMACOLOGY 2003 (PART 36)
 20 p |
  95
|
95
|  15
15
-
Chapter 075. Evaluation and Management of Obesity (Part 1)
12 p | 93
| 8
-

Chapter 075. Evaluation and Management of Obesity (Part 6)
7 p | 82
| 7
-
Chapter 075. Evaluation and Management of Obesity (Part 2)
7 p | 84
| 6
-

Chapter 075. Evaluation and Management of Obesity (Part 4)
5 p | 83
| 6
-

Chapter 075. Evaluation and Management of Obesity (Part 7)
5 p | 76
| 5
-

Chapter 075. Evaluation and Management of Obesity (Part 3)
5 p | 74
| 5
-
Chapter 074. Biology of Obesity (Part 3)
5 p | 120
| 4
-

Chapter 074. Biology of Obesity (Part 6)
5 p | 72
| 4
-

Chapter 075. Evaluation and Management of Obesity (Part 5)
5 p | 98
| 4
-

Chapter 074. Biology of Obesity (Part 2)
5 p | 68
| 3
-
Chapter 074. Biology of Obesity (Part 1)
5 p | 70
| 3
-

Chapter 074. Biology of Obesity (Part 5)
7 p | 67
| 3
-
Chapter 074. Biology of Obesity (Part 4)
6 p | 73
| 3
-
Chapter 074. Biology of Obesity (Part 7)
5 p | 85
| 2
-
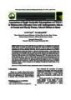
Associations of single nucleotide polymorphism rs17782313 in melanocortin 4 receptor gene with anthropometric indices in normal and obesity primary school children in Hanoi
7 p | 12
| 0
-
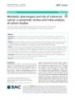
Metabolic phenotypes and risk of colorectal cancer: A systematic review and meta-analysis of cohort studies
14 p | 12
| 0


Chịu trách nhiệm nội dung:
Nguyễn Công Hà - Giám đốc Công ty TNHH TÀI LIỆU TRỰC TUYẾN VI NA
LIÊN HỆ
Địa chỉ: P402, 54A Nơ Trang Long, Phường 14, Q.Bình Thạnh, TP.HCM
Hotline: 093 303 0098
Email: support@tailieu.vn
Giấy phép Mạng Xã Hội số: 670/GP-BTTTT cấp ngày 30/11/2015 Copyright © 2022-2032 TaiLieu.VN. All rights reserved.

