


Summary of technical PhD thesis: Study on water resources security for sustainable development of Ma river basin
lượt xem 4
download
 Download
Vui lòng tải xuống để xem tài liệu đầy đủ
Download
Vui lòng tải xuống để xem tài liệu đầy đủ
Research purposes: To establish indicators of WRS for river basins in Viet Nam which are appropriate to charateristics and water use of basins; To use the proposed indexs to assess WRS for typical regions in Ma river basin; subsequently, proposing oriented solutions to make WRS feasible and appropriate to real conditions.
Bình luận(0) Đăng nhập để gửi bình luận!
Nội dung Text: Summary of technical PhD thesis: Study on water resources security for sustainable development of Ma river basin
- MINISTRY OF EDUCATION AND MINISTRY OF AGRICULTURE TRAINING AND RURAL DEVELOPMENT THUYLOI UNIVERSITY NGUYEN THI MUI STUDY ON WATER RESOURCES SECURITY FOR SUSTAINABLE DEVELOPMENT OF MA RIVER BASIN Major: Soil and Water Environment Specialized Code: 9 44 03 03 SUMMARY OF TECHNICAL PHD THESIS HANOI, 2018 1
- The research is completed at Thuyloi university Scientific instructor: Prof. Dr. Le Đinh Thanh Name of Supervisor 1: Name of Supervisor 2: Name of Supervisor 3: The dissertation shall be defensed at the Thesis Assessment Board of the University at ...... on ........... The dissertation may be found at the library: - National Library - Thuyloi university library 2
- PREAMBLE 1. Rationales At present, WRS (WRS) has become a major and urgent issue for many river basins and regions in the world, especially for transnational river basins and water-scarce territories. The Ma river basin is considered to be a place where has limited potentiality of water. However, there are still tensions in the exploitation and use of water resources for the following reasons: (i) The unequal distribution of water resources both in terms of space and time has caused floods and droughts, affecting the exploitation and use of water among regions in the basin; (ii) Disasters, floods and droughts on the Ma river system frequently occur; (iii) The hydrological regime in the main stream and on the tributaries of the Ma River basin has changed a lot due to the consequence of the construction and exploitation by small and medium water-use works in the basin. In addition, extremely unusual weather patterns and climate change are also major causes of storms, floods and depletion of water resources in the basin; (iv) Water in the basin has been seriously polluted, specially on the Lung, Lach Truong, Yen rivers, and downstream of the Ma river. To contribute more scientific and practical foundations for planning, exploitation and management of water resources with an aim to promote more sustainable socio-economic development and more effectively protect environment in the Ma river basin in the curent conditions, it is necessary to develop "indicators for WRS " as a tool for the sustainable development in the basin. 2. Research purposes - To establish indicators of WRS for river basins in Viet Nam which are appropriate to charateristics and water use of basins; - To use the proposed indexs to assess WRS for typical regions in Ma river basin; subsequently, proposing oriented solutions to make WRS feasible and appropriate to real conditions. 3
- 3. Research subjects and scope The research subjects are the elements of surface water resources and environment in the Ma river basin in order to establish a "set of indicators" for WRS and sustainable environmental protection. The spatial scope: The Ma river basin in the territory of Vietnam (including Dien Bien, Son La, Hoa Binh, Nghe An and Thanh Hoa provinces). The temporal scope: to identify indicators for WRS in the Ma River basin in 2015 and in the future by 2030. 4. Research approaches and methods The research approaches: from systematic, integrated management of water resources and sustainable development standpoints The research methods: the method of field survey; the method of inheritance and expert analysis; the method of environmental hydrological modeling; the methods of statistical analysis and synthesis; and the map method. 5. Scientific and practical significance Scientific significance: contributing to raising awareness, updating knowledge and methodology on WRS in Vietnam, especially direct researches on WRS in the Ma river basin haven’t been conducted yet. Practical significance: contributing to improving the efficiency of the exploitation and use of water resources by indicators for WRS and proposing some solutions to the sustainable environmental protection in the different regions in the Ma river basin. From there, further researches on other basins could be conducted. 6. New contributions - The dissertation studies and formulates a set of indicators for WRS in accordance with the conditions and characteristics of the exploitation and use of water resources in the river basins in Vietnam to serve sustainable socio- economic development in the basins - Applying the proposed set of indicators for WRS to calculate indicators for three typical regions with high levels of water and environmental pressures in the Ma river basin. From that, some solutions to WRS are proposed to enhance sustainable socio-economic development and environmental protection in the basin. 4
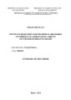
- CHARTER 1: AN OVERVIEW OF WATER RESOURCES SECURITY AND INTRODUCTION TO MA RIVER BASIN 1.1. Definitions of water resources security At present, there are various definitions of WRS such as: In 2000, the Global Water Partnership introduced the concept of WRS, which is that "WRS is the guarantee of water safety at all levels from home to global. It means that everyone is provided with sufficient clean water with affordable costs in order to meet their essential needs in lives and at the same time, ensuring that the natural environment is preserved and promoted" In 2007, D.Grey and C.W.Sadoff defined the "WRS" as the availability of water in terms of its reserves and quality for health, lives, ecosystems, and production taking the risk to people, environment and economy into account". To put it simply, WRS involves the exploitation and use of water resources while limiting negative impacts on them. 1.2 An overview of water resources security In the world, WRS has been studied in terms of both methodology and a set of indicators applied to different regions. Each research has its own approaches and each researched region has its different characteristics so that indicators for WRS and calculation methods applied are also different. In Vietnam, WRS is a new issue so that there are very few studies on it. This issue is still open, not yet studied in the Ma river basin, 1.3. Introduction to the Ma river basin 1.3.1. The Ma river basin and its major tributaries The Ma river basin covers Dien Bien, Son La, Hoa Binh, Nghe An, Thanh Hoa provinces and a part of Lao PDR. The total area of the basin is 28,400 km2, in which the Vietnam Figure 1.1 The map of the Ma area is 17,600 km2, accounting for river basin and its vicinity 5
- 62% and the Laos area is 10,800 km2, accounting for 38%. The Ma river has four major tributaries: the Chu river, the Buoi river, the Cau Chay river, the Chuong river, and two main distributaries: the Len river and the Lach Truong river. 1.3.2. Social and economic conditions Cultural, social residents: According to the statistics, the population in the Ma river basin in 2015 was 4,098,686 people. The rate of population growth was 1.5%, in which the natural population growth rate in Thanh Hoa was around 0.68% with mountainous regions 2%. The average population density was 233 persons/km2, in which the highest was in Thanh Hoa city with 2,407 people/km2, the lowest was in Sop Cop with only 31 people / km2. Major economic sectors: There are many economic sectors in the basin such as agriculture, industry, daily life, animal husbandry, aquaculture, tourism ... and many industrial parks such as Đinh Huong, Le Mon, Lam Son; Nghi Son economic zone; and many other industrial and handicraft clusters. 1.3.3. Water resources in the Ma river basin related to water resources security and environmental protection 1.3.3.1. Water quantity Rain: The rainfall is about 1,600 mm but unevenly distributed by space (between regions) and time (months) in the year. The total rainfall accounts for 70-90% in the rainy season and only 10-30% in the dry season of the total annual rainfall. The uneven distribution of rainfall causes floods in the rainy season and water shortage in the dry season, which leads to droughts and salt instrution Stream flow: The average annual stream flow is about 18 billion m3, corresponding to the flow of 570 m3/s. The flow module is 20 l/s.km2. In particular, the flow generated is 14.1billion m3 with a module of 25.3 l/s.km2 in the territory of Vietnam and 3.9 billion m3 with a module of 11.4 l/s.km2 in Laos. 6
- 1.3.3.2. The characteristics of the Ma river basin related to water resources security and environmental protection (1). The main part of the Ma river basin is in Vietnam but its upstream part is in Laos so its partial water sources is generated outside the territory of Vietnam related to Laos and other upstream countries where they are increasingly exploited and used. (2). The water sources in the Ma river basin are plentiful but unevenly distributed by space and time, causing floods in the rainy season and water shortage in the dry season, which leads to droughts and salt instrution (3). As a large river basin in the Central, its terrain is divided and complicatedly changed so that the water sources in the Ma river basin vary and significantly evolve by space (between regions) and time (between two flood and dry seasons). This will affect the exploitation and use of water sources between regions, thereby affecting WRS in the river branches and regions in the basin. 1.3.4. Environment, water quality and natural disasters 1.3.4.1. On the water quality There has been heavy pollution concentrated in the main river branches. The branches of the Buoi river and Cau Chay river have shown signs of pollution. Those of the Lung Truong, Lach Truong and Yen rivers, and the downstream of the Ma river have been severely polluted at the discharge points of industrial parks and clusters, and rivers flowing through crowded residential regions. In the future, new and expanded industrial zones and clutches will increase pressures on environment. There are frequent natural disasters in the Ma river basin such as storms, floods, droughts, saline intrusion, climate change, flash floods, landslides, etc.,which have caused great damages to socio-economic development and people in the Ma river basin. 7
- 1.3.5. The exploitation, use and planning for water resources management in the Ma river basin Works to exploit and use water: There are hundreds of irrigation and hydropower projects which have been built across the tributaries in the Ma river basin. This has affected the ecology and environment of the river. Planning for and management of water resources in river basins: Water resources management in the river basin is mostly in the traditional way; there is no plan for sharing and rational allocation of water sources among sectors as well as for ecosystem and environment. There are continuing conflicts in water use between regions and/or sectors; no planning for river basin management has been prepared and approved by the State. No Ma river basin management board has been established. 1.4. The limitations and shortcomings in previous researches into water resources security and the dissertation’s research orientations 1.4.1. The limitations and shortcomings So far, there have been many studies on the Ma river basin in Vietnam, but focused only on the following issues: - Most of the researches concentrated in the basin area while the number of rivers in Vietnam accounts for up to 63% of total flows from foreign countries, which makes it difficult for Vietnam to take the initiative in the exploitation, use and management of water resources for enhancing its socio-economic development and environmental protection; - The researches focused solely on individual purposes of each region without regard to other water use sectors, which has led to inadequacies, unsustainable water resources in the basin; - The WRS in Vietnam is a new issue so that there are very few studies on it. In the current Ma river basin, this issue is still open, not yet studied. 8
- 1.4.2. The research orientations of the dissertation The research orientations of the dissertation are summarized in Figure 1.2. Conclusion of Chapter 1: WRS is a new field in the world and in Vietnam. Although there are many studies on it in the world, each region/basin has its different characteristics. Therefore, the indicators for WRS also vary according to the conditions of each region/ basin. In Vietnam, the researches on WRS are still limited. No direct and specific researches for river basins, especially for the Ma river Figure 1.2 Flowchart of the basin, have been conducted and there have Ma river basin security indicators been many issues related to WRS in the basin. CHAPTER 2: RESEARCH INTO DEVELOPING INDICATORS FOR WATER RESOURCES SECURITY IN THE RIVER BASINS IN VIETNAM 2.1. Methods and principles for building and selecting indicators for water resources security The dissertation establishes a set of indicators for WRS based on the SMART criteria, which stands for Specific–Measurable –Attainable–Realistic–Times. These criteria show the state of WRS governed by five factors which are specific and easy to understand, measurable, realistic and completion time (Shahin và Mahbod, 2007). Each character in the SMART refers to a different criterion for evaluating the target. When conducting the research, the dissertation uses the SMART criteria to select and construct specific indicators. 9
- The set of the indicators for WRS are constructed and selected according to such principles as assessment must be suitable and widely accepted; selected indicators must be clearly defined and verifiable; they must be measured by a precise method at a reasonable cost; they must be highly sensitive and their trends of change must be showed; and they must be comprehensively representative and no too many indicators. 2.2. Research into building a set of indicators for water resources security in Vietnam river basin Based on the methodology, the SMART criteria, the above-mentioned principles as well as specific conditions in the basin, the dissertation studies, selects and analyzes the six groups of indicators for WRS including 18 indicators: Table 2.1 Summary of indicators for WRS in the river basins in Vietnam Names and notations of No Units The calculation formula Interpretation the indicators I. WSI(1)- Group of indicators for WRS built related to water resources flowing into river basins WSI(1,1)- Indicators for Q: annual average flow in many 3 1 WRS based on the l/s.km2 M0 = Q x10 years in the basins; abundance of water F F: basin area resources M0 WSI(1,2)- Indicators for n Ki: modulus of the i-th year; 2 WRS based on the level K i 1 2 n: total number of years i 1 of water change in river Cv n 1 basins Cv II. WSI(2)- Group of indicators for WRS built related to clean water supplied to the people WSI(2,1)- Indicators for P Pat: number of people provided WRS based on the level at with safe drinking water; 3 % x100% of clean water supplied P: total population in the area P to the population WSI(2,2)- Indicators for Pp: Number of people provided WRS based on the level P with clean water from p x100% 4 of clean water supplied % P concentrated water supply by concentrated water works; supply works P: Total population in the area Wvs: Number of the family with WSI(2,3)- Indicators for W 5 WRS based on level of % VS x100% a hygienic latrine; water source protection Wh Wh: Total number of households in the region WSI(2,4)- Indicators for W Wsd: Amount of water used by WRS based on the level sd people from concentrated water 6 % x100% of water losses by supply works; Wc concentrated water Wc: Amount of water from 10
- supply works concentrated water supply works III. WSI(3)- Group of indicators for WRS built based on the level of exploitation and use of water in the river basin WSI(3,1)- Indicators for Wsd: Total water used in the W 7 WRS based on the level % sd x100% basin; of exploitation and use of W W: Total amount of water water in the basin flowing into river basin WSI(3,2)- Indicators for GDPNN: Gross domestic product GDP in the agricultural sector; USD/m3 NN 8 WRS based on water use W efficiency for agriculture NN WNN: Total amount of water used in agriculture WSI(3,3)- Indicators for GDPCN: Gross domestic product GDP in the industry; USD/m3 CN 9 WRS based on water use WCN efficiency for industry WCN: Total amount of water used in industry IV. WSI(4)- Group of indicators for WRS built related to ecosystem and river environment protection WSI(4,1)- Indicators for Q0: Annual average flow in WRS based on degree of many years 10 water retention for the m3/s %Q0 ecosystem and the main river environment WSI(4,2)- Indicators for WQI: Water quality index on WRS based on mainstream WQ 11 evaluation of water I quality / water pollution in main river WSI(4,3)- Indicators for WRS based on considering the effects of use and exploitation of Quantity, positions and 12 water by lakes, dams, works functions of works hydroelectricity, conversion of flows, and degradation of ecosystem and river environment V. WSI(5)- Group of indicators for WRS built based on risks and damages caused by natural disasters WSI(5,1)- Indicators for GDP: Per capita income GD 13 WRS related to disasters USD/person/year P response WSI(5,2)- Indicators for Wbl: Damages caused by W 14 WRS related to risk, USD/person/year bl typhoons and floods damages caused by P P: Population in the basin in a storms and floods year WSI(5,3)- Indicators for Sh: Drought area S Sct: Cultivation area 15 WRS related to risk, % h x100% S damages caused by ct drought 16 WSI(5,4)- Indicators for ‰ S S: Salinity 11
- WRS related to risk, damages caused salt intrusion VI. WSI(6)- Group of indicators for WRS built related to the management of water resources and river basin Evaluation based on legal basis, WSI(6,1)- Indicators for level and results of water WRS based on results of Water resources resources management in the 17 water resources management river basin, especially the management integrated management of water resources WSI(6,2)- Indicators for Evaluation based on legal basis, WRS based on results of level and results of integrated 18 River basin management integrated management river basin management of river basin 2.3 Determining integrated indicators for water resources security in Vietnam river basins Integrated indicators for WRS are calculated according to the formula: (1). Indicators for WRS in the group: are calculated by the weighting method based on the basis of scores of indicators for WRS and determined according to the following formula: m v j WSIi, j j 1 (2.1) WSIi v Of which: WSIi: indicators for WRS in the ith group; WSIi,j: scores of the jth indicator in the ith group; i: numerical order in the group; j: numerical order of the indicator j=1-m; m: total indicators for WRS in a group; vj: weight of the jth indicator; v: total weights in a group of indicators. (2). Regional indicators for WRS: synthesis of indicators for WRS in groups in basins or regions concerned and interdependent are calculated according to weighting method of groups of indicators according to the following formula: n w i WSIi i 1 (2.2) WSI w Of which: WSI: regional indicators for WRS; WSIi: indicators for WRS in the i group; n: total number of indicator groups; wi: the weight of the ith group, w: th total weight of indicator groups of WRS. 12
- (3). Classifying levels of water source security. Based on the indicators for WRS in the area, the indicator group is divided into 5 levels as follows: If WSI = 1: Water sources security at a very low level (very insecure water source) 2: Water sources security at a low level (insecure water source) 3: Water sources security at a average level (secure water source) 4: Water sources security at a high level 5: Water sources security at a very high level 2.4 Proposed indicators for water resources security in the Ma river basin Due to the characteristics of the different river basins, when applied to the Ma river basin, only 17 indicators with high reliability and best characteristics were selected. Indicators, indicator groups, and their classified levels in the Ma river basin are presented in Table 2.2. Table 2.2. Summary of indicators and scales for WRS in the Ma river basin Assessment scale and secure level of WRS Notation No Indicators Units Very Very s Low Average High low high I. WSI(1)- Group of indicators for WRS related to WRS flowing to river basins Indicators for WRS 1 based on the WSI(1,1) l/s.km2 20-40 >40-60 >60 abundance of water resources Indicators for WRS based on the level of 2 WSI(1,2) >0.4 0.4->0.3 0.3->0.2 0.2-0.1 80-90 >90 clean water supplied to the population Indicators for WRS based on the level of 4 clean water supplied WSI(2,2) % 70-80 >80-90 >90 by concentrated water supply works Indicators for WRS based on level of 5 WSI(2,3) % 70-80 >80-90 >90 water source protection III. WSI(3)- Group of indicators for WRS based on the level of exploitation and use of water in the river basin Indicators for WRS 6 based on the level of WSI(3,1) % >70 70->40 40->30 30-20
- of water in the basin Indicators for WRS 7 based on water use WSI(3,2) USD/m3 0.2-0.35 >0.35-1 >1 efficiency in agriculture Indicators for WRS 8 based on water use WSI(3,3) USD/m3 5.5-20 >20-50 >50 efficiency in industry IV. WSI(4)- Group of indicators for WRS related to ecosystem and river environment protection Indicators for WRS based on degree of 9 water retention for WSI(4,1) m3/s 10- (>20- >30% the ecosystem and 20)%Q0 30)%Q0 Q0 the main river environment Indicators for WRS based on evaluation 10 WSI(4,2) 50-75 >75-90 >90 of water quality in main river Indicators for WRS based on considering the effects of use and exploitation of water by lakes, dams, ≥1 on the 11 WSI(4,3) works >3 3 2 0 hydroelectricity, tributaries conversion of flows and degradation of ecosystem and river environment V. WSI(5)- Group of indicators for WRS based on risks and damages caused by natural disasters Indicators for WRS USD / 516- >1035- >4085- 12 related to the ability WSI(5,1) 12614 person / year 1035 4085 12614 to cope with disasters Indicators for WRS related to risk, USD / 13 WSI(5,2) >8 8->4 4->2 2-1 40 40->20 20->10 10-5 3 3->1 1->0.5 0.5-0.25
- Conclusion of the chapter 2: The dissertation builts 18 indicators divided into 6 groups indicating the secure levels of WRS in Vietnam basins. It also selects 17 specific indicators in line with practical conditions to assess the secure levels of WRS in the Ma river basin. The proposed indicators for WRS will be calculated in Chapter 3. CHAPTER 3: DETERMINING THE INDICATORS FOR WATER RESOURCES SECURITY AND PROPOSING SOLUTIONS TO THE WATER SOURCE SECURITY IN THE BASIN 3.1. Introduction The Ma river basin encompasses many different natural conditions so that the impact on the water source security will be different. Therefore, to assess it, it is necessary to evaluate each region and then evaluate the whole basin. The dissertation selects the regions where their water resources are at risk most as typical ones for calculating the indicators for WRS and assessing the water source security in the Ma river basin.. 3.1.1 Calculation of water balance in Ma river basin 3.1.1.1 Classification of water balance The disertation inherits the results of the water balance by the Institute of Water Resources Planning in 2015 in order to divide the Ma river basin located in Vietnam into eight regions: Region I: upstream Ma river; Region II: middlestream Ma river; Region III: Buoi river basin; Region IV: northern Ma river; Region V: Cau Chay river basin; Region VI: Am river basin; Region VII: upstream Chu Figure 3.1. Water balance in Ma river river; Reagion VIII: southern basin and its vicinity Chu river 15
- 3.1.1.2. Water balance in the basin In order to calculate water balance in the Ma river basin, the dissertation bases on the equation of water balance for a region in the calculation period: Wflowing into -Wused = ±ΔW (3.1) Of which: Wflowing into: Total flow at the calculation node of the stream basin (m3); Wused: Total amount of water used by all industries at the calculation node (m3); ± ΔW Changes of the amount of water stored in the region during the calculation period. Based on natural and socio-economic conditions in the Ma River basin, the dissertation uses the MIKE-NAM model - a longitudinal correlation method - to add the flow data from stations with short measurement data in order to determine the flow at the outlet of the basin. In addition, it also uses water-use criteria to determine demands for water use in the basin industry as an input to water balance problem. Constructing a water balance scenario in the basin: The dissertation conducts a research into water balance in Ma river basin on three scenarios: (i) Scenario of natural status quo and socio-economic development in 2015 (status quo scenario 2015); (ii) socio-economic development scenario by 2030 (development scenario 2030); (iii) Socio-economic development scenario by 2030 with consideration of climate change (development scenario 2030+ climate change). The results of water balance: Using the WEAP model to calculate water balance in 08 regions in the Ma river on the basis of considering operations of works in the basin; their operating procedures, their regression flow after irrigation. Water balance results are as follows: Scenario of natural status quo in 2015 (status quo scenario 2015): 4 out of 8 regions with no water shortage: region I (upstream Ma river); region II (middlestream Ma river); region VI (Am river basin); region VII (upstream Chu river). The remaining 4 regions with water shortage: region III (Buoi river basin); region IV (northern Ma river); region V (Cau Chay river basin); region VIII (southern Chu river). Water shortages last from January to April. The six 16
- months with water shortage are in March. The region with the most water shortage is region VIII. Table 3.1. Water shortages in water balance in the Ma river basin, status quo scenario 2015 (106m3) Months Regions 7 8 9 10 11 12 1 2 3 4 5 6 Total I 0 0 0 0 0 0 0 0 0 0 0 0 0 II 0 0 0 0 0 0 0 0 0 0 0 0 0 III 0 0 0 0 0 0 29.5 39.9 49.9 46.6 0 0 165.9 IV 0 0 0 0 0 0 23.2 15.4 109.9 87.3 0 0 235.8 V 0 0 0 0 0 0 63.2 33.8 53.1 50.6 0 37.6 238.2 VI 0 0 0 0 0 0 0 0 0 0 0 0 0 VII 0 0 0 0 0 0 0 0 0 0 0 0 0 VIII 0 0 0 0 0 0 0.5 11.5 118.8 68.9 0 57.9 257.7 Total 0 0 0 0 0 0 116.5 100.6 331.7 253.4 0 95.5 897.60 Socio-economic development scenario by 2030 (development scenario 2030): Similar to status quo scenerio 2015, there are also four regions with water shortages lasting from January to April. In general, the largest water shortage is still concentrated in March. The most deficient is still in region VIII (southern Chu river). Table 3.2. Water shortages in water balance in the Ma river basin, development scenario 2030 (106m3) Regions Months 7 8 9 10 11 12 1 2 3 4 5 6 Total I 0 0 0 0 0 0 0 0 0 0 0 0 0 II 0 0 0 0 0 0 0 0 0 0 0 0 0 III 0 0 0 0 0 0 47.2 47.6 59.2 61 8.7 12.1 235.7 IV 0 0 0 0 0 0 37.2 21.8 111.6 84.5 0 0 255.1 V 0 0 0 0 0 0 73.9 30.2 44.5 41.4 0 28.7 218.6 VI 0 0 0 0 0 0 0 0 0 0 0 0 0 VII 0 0 0 0 0 0 0 0 0 0 0 0 0 VIII 0 0 0 0 0 0 27.7 12.3 121.1 74.8 17.3 72.4 325.50 Total 0 0 0 0 0 0 185.9 111.9 336.4 261.7 25.9 113.2 1,035.00 Socio-economic development scenario by 2030 with consideration of climate change (development scenario 2030 + climate change): Similar to the two above scenerios, there are also four regions with water shortages lasting from January to June. The largest water shortage is still concentrated in March. The most deficient is still in region IV (northern Ma river). The calculated results of water balance in this scenario demonstrate that the impact of climate change on 17
- water resources and demands in the Ma river basin is significant. It is important to consider the effects of climate change in the future. Table 3.3. Water shortages in water balance in the Ma river basin, development scenario 2030 + climate change (106m3) Months Regions 7 8 9 10 11 12 1 2 3 4 5 6 Total I 0 0 0 0 0 0 0 0 0 0 0 0 0 II 0 0 0 0 0 0 0 0 0 0 0 0 0 III 0 0 0 0 0 0 45.8 46.9 59.4 60.9 7.0 7.3 227.3 IV 0 0 0 0 0 0 54.5 35.2 128.3 107.6 7.4 25.6 358.8 V 0 0 0 0 0 0 75.1 31.4 46.4 44.0 0.0 28.2 225.1 VI 0 0 0 0 0 0 0 0 0 0 0 0 0 VII 0 0 0 0 0 0 0 0 0 0 0 0 0 VIII 0 0 0 0 0 0 34.7 14.1 124.7 78.8 8.9 73.2 334.3 Total 0 0 0 0 0 0 210.1 127.5 358.8 291.3 23.3 134.3 1,145.4 3.1.2. Water quality and salinity intrusion The water quality in the upstream Ma river is relatively good because of low socio-economic development, and the load of pollutants remains in the self- cleaning capacity of the environment. The middlestream and downstream are seriously polluted at Buu river, Cau Chay river, which show signs of deterioration in water quality; The downstream Ma river, Lung river, Lach Truong river, and Yen river are heavily polluted at the discharge points of industrial parks and clusters, and rivers flowing through crowded residential regions. In the downstream, saline intrusion has been increasingly occurring at the widest range. The most salinised year is 2010. Specific measures to protect the water quality in these regions should be taken. 3.1.3 Conflicts in water use and stress levels in the basin Conflicts in water use in the basin: Due to the characteristics of water sources and water demands, there have been conflicts over water among sectors, specifically among agriculture, ecosystems and river environment; among hydropowers, irrigation, ecosystem, and river environment; and among upstream, middlestream and downstream. Level of water stress in the basin: Estimating the level of water stress is determined by the ratio between the amount of water used and flowing into the basin. Based on the level of water stress estimated by Raskin et al. in 1997, the dissertation determines as follows: 18
- Table 3.4. Evaluation of stress level in water used in the Ma river basin regions The year of 2015 The year of 2030 Regions Wused Wflowing into Ratio (%) W used Wflowing into Ratio(%) (106 m3) (m3/s) Wused /Wflowing into (106 m3) (m3/s) Wused/Wflowing into I 607.2 123.9 15.5 591 123.1 15.2 II 381.7 322.2 3.8 382 291.6 4.2 III 483.6 44.7 34.3 530.7 45.8 36.7 IV 1020.6 19.89 162.7 1153.7 20.8 176.1 V 639.9 20.87 97.2 614.9 19.58 99.6 VI 94 25.7 11.6 88.7 25.8 10.9 VII 116.4 153.6 2.4 89.7 143.9 2.0 VIII 2029.2 66.0 97.5 2272.8 68.2 105.7 As such, there are water stresses in four regions: Region III (Buoi River); Region IV (Northern Ma river); Region V (Cau Chay river); Region VIII (Southern Chu River) in 2015 and forecasts by 2030. 3.1.4. Selected typical regions to evaluate water resources security in the Ma river basin Based on the above results, the dissertation studies and selects three typical regions to evaluate indicators for WRS as in Table 3.5. Table 3.5. Selected regions to evaluate WRS No Studied regions Ftn (ha) Fct ( ha) Wshortage(106 m3) 1 Region III: Buoi river basin 168,636.0 34,477.9 165.9 2 Region IV: Northern Ma river 90,307.5 37,856.5 235.8 3 Region VIII: Southern Chu river 286,944.2 81,533.8 257.7 3.2 Determining indicators for water resources security for typical regions in the Ma river basin in 2015 and by 2030 3.2.1. The basis for determining weights of indicators and groups of indicators for water resources security In the set of indicators for WRS in the Ma river basin, indicators and groups of indicators reflecting different levels of impact on WRS are identified in Chapter 2. Based on the level and significance of the impact, it is necessary to determine the weighs of indicators and groups of indicators. The indicators in a group must have equal weights. The ones with weighted indicators are divided into three groups with a total weight equal to 1 and used for 2015 and 2030. Table 3.6. The weights of the regional groups of indicators for WRS in typical regions in the Ma river basin No The degree of influence on WRS Group of indicators Weight 1 Group of indicators directly affects water source security WSI(1); WSI(2); WSI(3) 0.2 2 Group of indicators indirectly affects water source security of high WSI(4) 0.15 importance 3 Group of indicators indirectly affects water source security WSI(5); WSI(6) 0.125 19
- 3.2.2. Calculating indicators for water resources security for typical regions in the basin Based on the scores of indicators for WRS for identified regions and the weights of the indicators and groups of indicators determined above. The dissertation calculates indicators for WRS for typical regions in the basin for 2015, and forecasts for 2030: Table 3.7. Indicators for WRS for typical regions in the Ma River basin for 2015, 2030 The year of 2015 The year of 2030 N Group of indicators Weight Region Region Region Region Region Region o III IV VIII III IV VIII WSI(1)- Group of indicators related to 1 the water source flowing into the river 0.2 2.5 2.0 2.5 2.0 2.0 2.0 basin WSI(2)- Group of indicators related to 2 0.2 2.0 3.0 2.7 3.7 4.0 4.0 clean water supplied for the people WSI(3)- Group of indicators based on 3 the level of water exploitation and use 0.2 2.7 3.3 3.0 3.0 3.0 2.3 in the river basin WSI(4)- )- Group of indicators related 4 to the protection of ecosystem and 0.15 4.0 2.7 2.3 4.0 3.0 3.0 river environment WSI(5)- Group of indicators based on 5 the risks and damages caused by 0.125 3.0 2.0 2.8 3.0 3.0 3.3 natural disasters WSI(6): Group of indicators related to 6 water resources and river basin 0.125 3.0 3.0 3.0 4.0 4.0 4.0 management Total WSI 1.0 2.78 2.69 2.70 3.21 3.13 3.03 (a) (b) Hình 3.2. Indicators for WRS for typical regions in the Ma River basin: a) the year of 2015; b) the year of 2030 20
CÓ THỂ BẠN MUỐN DOWNLOAD

-
Summary of PhD Thesis in Biology: Study on the effects of LED on some physiological characteristics, yield and quality of hydroponic cultivated spinach (Spinacia oleracea L.)
 26 p |
  32
|
32
|  4
4
-
Summary of technical phd thesis: Research some solutions to improve the quality of signal receiver in radar
27 p | 24
| 3
-
Summary of phd thesis: Study on selection and technical measures to improve waterlogging ability of winter soybean in Hanoi
27 p | 23
| 2
-

Summary of phd thesis: Study on selection and technical measures to improve waterlogging ability for Winter soybean in Hanoi
27 p | 18
| 2


Chịu trách nhiệm nội dung:
Nguyễn Công Hà - Giám đốc Công ty TNHH TÀI LIỆU TRỰC TUYẾN VI NA
LIÊN HỆ
Địa chỉ: P402, 54A Nơ Trang Long, Phường 14, Q.Bình Thạnh, TP.HCM
Hotline: 093 303 0098
Email: support@tailieu.vn
Giấy phép Mạng Xã Hội số: 670/GP-BTTTT cấp ngày 30/11/2015 Copyright © 2022-2032 TaiLieu.VN. All rights reserved.

