


Thông tin thiết kế mạch P9
lượt xem 9
download
 Download
Vui lòng tải xuống để xem tài liệu đầy đủ
Download
Vui lòng tải xuống để xem tài liệu đầy đủ
SIGNAL PROCESSING IN THE TELEPHONE SYSTEM Until the introduction of the digital telephone, there was virtually no signal processing on the subscriber loop. Indeed, there was no need for it. The majority of subscriber loops were able to transmit voice signals with no particular difficulty and in cases where the lines were longer than usual, line ‘‘loading’’ was used with success. Signal processing has two major aims: (1) To improve the quality of signal transmission over the telephone communication channels....
Bình luận(0) Đăng nhập để gửi bình luận!
Nội dung Text: Thông tin thiết kế mạch P9
- Telecommunication Circuit Design, Second Edition. Patrick D. van der Puije Copyright # 2002 John Wiley & Sons, Inc. ISBNs: 0-471-41542-1 (Hardback); 0-471-22153-8 (Electronic) 9 SIGNAL PROCESSING IN THE TELEPHONE SYSTEM 9.1 INTRODUCTION Until the introduction of the digital telephone, there was virtually no signal processing on the subscriber loop. Indeed, there was no need for it. The majority of subscriber loops were able to transmit voice signals with no particular difficulty and in cases where the lines were longer than usual, line ‘‘loading’’ was used with success. Signal processing has two major aims: (1) To improve the quality of signal transmission over the telephone commu- nication channels. (2) To lower the cost of communication by improving the efficiency of channel use. In general, the quality of a communication channel tends to deteriorate with distance. In addition, long distance channels are expensive to establish and maintain. It follows that the more messages that can be transmitted in a given time, the lower the cost per message. It is therefore on the long-distance channels (trunks or tolls) that signal processing techniques have proven to be most successful. In this chapter the common signal processing techniques used in the telephone system and some of the circuits employed will be examined. 9.2 FREQUENCY DIVISION MULTIPLEX (FDM) Frequency division multiplex (FDM) is a technique in which a number of signals can be transmitted over the same channel by using them to modulate carrier signals with 267
- 268 SIGNAL PROCESSING IN THE TELEPHONE SYSTEM different and appropriate frequency so that they do not interfere with each other. The assignment of specific carrier frequencies to radio stations for broadcasting and other purposes is, in fact, FDM. It can be used with amplitude modulation as well as other forms of modulation. In the context of the telephone, FDM is used in conjunction with amplitude modulation. In normal amplitude modulation, the carrier, upper and lower sidebands are transmitted. When the depth of modulation is 100%, the amplitude of the carrier voltage is twice that of the sidebands. The power in the carrier is therefore 2 of the 3 total. Unfortunately, the carrier has no information content. Each of the sidebands contains 1 of the total power. In radio, 100% modulation is almost never used so the 6 power content of the sidebands is much less than described. It is noted that the information content is duplicated in the two sidebands. It is clear that one way to beat the corrupting influence of noise on the information content of the transmission is to put as much as possible, if not all, of the available power into one of the sidebands. An added advantage to this scheme is that the required bandwidth is reduced to one-half of its original value. Clearly, this would allow twice as many messages to be sent on the same channel as before. The transmission of only one sideband in an AM scheme is called single-sideband (SSB) modulation. The price to be paid for this advantage is that to demodulate an SSB signal, it is necessary to reinstate the carrier at the receiver. The reinstated carrier has to be in synchronism with the original carrier, otherwise demodulation yields an intolerably distorted signal. Providing a synchronized local oscillator requires complex equipment at the transmitter as well as at the receiver. In SSB radio, an attenuated form of the carrier is transmitted with the signal. This is used to synchronize a local oscillator in the receiver. In the telephone system, a centrally generated pilot signal is distributed to all offices for demodulation purposes. In some cases, a local oscillator without synchronization is used. If the frequency error is small (approximately Æ5 Hz), successful demodulation can be achieved [7]. 9.2.1 Generation of Single-Sideband Signals A block diagram of the SSB generator is shown in Figure 9.1. Figure 9.1. The block diagram for SSB modulation.
- 9.2 FREQUENCY DIVISION MULTIPLEX (FDM) 269 The signal and the carrier are essentially multiplied by the balanced modulator to give a DSB-SC output. The bandpass filter removes either the lower or upper sideband. f ðtÞ ¼ A cos os t cos oc t ð9:2:1Þ A f ðtÞ ¼ ½cosðoc þ os Þt þ cosðoc À os Þt: ð9:2:2Þ 2 Assuming the upper sideband is eliminated, we get A f1 ðtÞ ¼ cosðoc À os Þt: ð9:2:3Þ 2 To eliminate the upper sideband, it is necessary to have a bandpass filter with a very sharp cut-off at the carrier frequency. This is not easy to achieve in practice, but the task is made simpler when the modulating signal os has no low-frequency components. Under this condition, crystal and electromechanical filters can be designed to suppress the upper sideband. This is the case for a telephone voice channel which is nominally from 300 to 3000 Hz. From Equation (9.2.3) only the lower sideband is transmitted. At the receiving end, the signal is demodulated (multiplied) by (the recovered) carrier, cos ot. The result is A f2 ðtÞ ¼ cosðoc À os Þt cos oc t ð9:2:4Þ 2 A A f2 ðtÞ ¼ cos os t þ cosð2oc À os Þt: ð9:2:5Þ 4 4 A low-pass filter is used to separate the required signal at frequency os from that at ð2oc À os Þ. 9.2.2 Design of Circuit Components The balanced modulator was discussed in Section 4.4.2.3. Filter design is outside the scope of this book but a representative list of books on filters is provided in the bibliography at the end of Chapter 3. 9.2.3 Formation of a Basic Group In the trunk or toll system, 12 channels form a basic group. The basic group is formed by SSB modulation of 12 subcarriers at 64, 68, 72; . . . ; 108 kHz. These carriers are generated from a 4 kHz crystal-controlled oscillator and multiplied by the appropriate factor. The upper sidebands are removed and they are added together to form the group. Figure 9.2(a) shows a block diagram for channel 1. Figure 9.2(b) shows the spectrum of the basic group.
- 270 SIGNAL PROCESSING IN THE TELEPHONE SYSTEM Figure 9.2. Formation of the basic group with spectra. Reprinted with permission from Transmission Systems for Communications, 4th Ed., AT&T, Bell Labs, 1970. For a small-capacity trunk, the basic group may be transmitted without further processing. The transmission channel can be a twisted pair or coaxial cable. 9.2.4 Formation of a Basic Supergroup For higher capacity channels, five basic groups are combined to form a basic supergroup. Figure 9.3(a) shows the block diagram of the basic supergroup 1. Note that to make the filtering problem easier, the carrier frequency is chosen to be 420 kHz. Figure 9.3(b) shows the frequency spectrum of the basic supergroup. Table 9.1 shows the carrier frequencies and bandwidths for each basic super- group. For a 60-channel trunk, the signal can be transmitted in this form. Again a twisted pair with coil loading or amplification and coaxial cable may be the medium of transmission. By organizing the 12 basic groups into a basic supergroup of 5 it clear that the subcarrier frequencies, the balanced modulators. and bandpass filters can all be duplicated five times over. If the basic group had been made larger, new subcarrier frequencies would have had to be generated and bandpass filters of different characteristics would have been necessary. 9.2.5 Formation of a Basic Mastergroup To create a 600-channel trunk, 10 basic supergroups are combined to form a basic mastergroup. The frequency spectrum of the basic mastergroup is shown in Figure 9.4.
- 9.2 FREQUENCY DIVISION MULTIPLEX (FDM) 271 Figure 9.3. Formation of the basic supergroup with spectra. Reprinted with permission from Transmission Systems for Communications, 4th Ed., AT&T, Bell Labs, 1970. Note that there are gaps of 8 kHz between each basic supergroup spectrum. These gaps are designed to make the filtering problem easier. The carrier frequencies and bandwidths of the 10 basic supergroups are given in Table 9.2. The basic supergroup can be transmitted over coaxial cable or it can be used to modulate a 4 GHz carrier for terrestrial microwave transmission or even sent over a satellite link. TABLE 9.1 Supergroup number Carrier frequency (kHz) Bandwidth (kHz) 1 420 312–360 2 468 360–408 3 516 408–456 4 564 456–504 5 612 504–552 Figure 9.4. Formation of the basic mastergroup with spectra. Reprinted with permission from Transmission Systems for Communications, 4th Ed., AT&T, Bell Labs, 1970.
- 272 SIGNAL PROCESSING IN THE TELEPHONE SYSTEM TABLE 9.2 Basic supergroup number Carrier frequency (kHz) Bandwidth (kHz) 1 1116 564–804 2 1364 812–1052 3 1612 1060–1300 4 1860 1308–1548 5 2108 1556–1796 6 2356 1804–2044 7 2652 2100–2340 8 2900 2348–2588 9 3148 2596–2836 10 3396 2844–3084 Other larger groups can be formed, for example 6 mastergroups may be combined to form a jumbogroup with 3600 voice channels. To recover the original baseband signals from the various groups, the appropriate number of filtering=demodulation processes will have to be carried out. At each stage of the demodulation process, the correct carrier will have to be reinstated for this to be possible. 9.3 TIME-DIVISION MULTIPLEX (TDM) In FDM, voice signals were ‘‘stacked’’ in the frequency spectrum so that many such signals could be transmitted over the same channel without interference. In time- division multiplex (TDM), each voice signal is assigned the use of the complete channel for a very short time on a periodic basis. The theoretical basis of this technique is the Sampling Theorem. An informal statement of the sampling theorem is: If the highest frequency in a signal is B Hz, then the signal can be reconstructed from samples taken at a minimum rate of 2B samples per second (Nyquist sampling rate or frequency). The proof of this theorem is beyond the scope of this book. However, there are a number of practical problems which arise in the application of the theorem: (1) The theorem assumes that the samples have infinitesimally narrow pulse widths. This is clearly not so in a practical circuit. The sampling rate is usually chosen to be higher than the Nyquist frequency since it is the minimum; it is discrete to avoid extreme conditions when dealing with an imperfect situation. (2) The theorem assumes that an ideal low-pass filter is used to remove all frequencies above B Hz ahead of the sampler. When using a practical filter, it
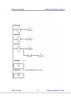
- 9.3 TIME-DIVISION MULTIPLEX (TDM) 273 is necessary to sample the signal at a higher rate (oversampling) to avoid distortion due to aliasing. A TDM system with two input signals is illustrated in Figure 9.5. The samplers or commutators are shown here as switches which are driven in synchronism. The TDM system shown in Figure 9.5 is an example of pulse amplitude modulation (PAM). Practical TDM systems based on PAM have been built and used in the telephone system (No. 101 ESS-PBX) [8]. 9.3.1 Pseudodigital Modulation To code an analog signal in pulse form one can use the height of the pulse, the width (or duration), or the position of the pulse relative to standard position. When the height is used, it is called pulse-amplitude modulation (PAM). When the coding is in terms of the width it is called pulse-width modulation (PWM) and when the position is used it is called pulse-position modulation (PPM). Pulse height, width, and position are analog quantities which in turn can be quantized and represented by a binary code where the digits are present, 1, or absent, 0. When this has been done the modulation scheme is called pulse-code modulation (PCM). Although PCM is qualitatively different from the other modulating schemes, they are compared in Figure 9.6. These schemes would work equally well in a noiseless environment. When noise is present, and it always is, PCM has a clear advantage over the others. In the case of PAM, PWM and PPM the receiver has to determine what the original amplitude, width, and position were respectively in order to reconstruct them. In PCM, the decision is simplified to whether the digit sent was a 1 or a 0. In all cases, it is necessary to transmit timing information with the signal so that the receiver knows where the bit stream starts and stops. 9.3.2 Pulse-Amplitude Modulation Encoder To illustrate the design principle of a PAM communication channel, a four-channel PAM system has been chosen. The coder or commutator is shown in Figure 9.7. The master clock drives the four-phase ring counter. The ring counter drives four sampling gates on and off in the correct sequence. When one of the four outputs is on, 1, all the others are off, 0; so only the sampling gate with the 1 is connected to the adder. Note that the second input to the fourth sampling gate are connected to the master clock. This means that channel 4 will always produce a positive pulse. The amplitude of this pulse is adjusted to be higher than the most positive value of the analog input voltage. This is called the synchronization pulse or sync pulse for short. It is used to identify and time the other channels. The design of the component circuits now follows. 9.3.2.1 Four-Phase Ring Counter. The four-phase ring counter and its timing diagram are shown in Figure 9.8.
- 274 Figure 9.5. A mechanical illustration of time-division multiplex (TDM) with pulse amplitude modulation (PAM). Reprinted with permission from B. P. Lathi, Modern Digital and Analog Communication Systems, CBS College Pub., New York, 1983.
- 9.3 TIME-DIVISION MULTIPLEX (TDM) 275 Figure 9.6. A comparison of PAM, PWM, PPM and PCM. Note that PAM, PWM and PPM are not truly digital since they convey information by the variation of analog quantities, that is, amplitude, duration and position in time. Reprinted with permission from B. P. Lathi, Modern Digital and Analog Communication Systems, CBS College Pub., New York, 1983.
- 276 Figure 9.7. A block diagram for a four-channel PAM system. Note that channel 4 is used for timing purposes.
- 9.3 TIME-DIVISION MULTIPLEX (TDM) 277 Figure 9.8. A block diagram of a four-phase ring counter with its timing diagram. It can be seen from the diagram that, in the time taken by one frame, the output pulses go through one cycle. The outputs are used to drive the sampling gates. 9.3.2.2 Series Sampling Gate. The configuration of the series sampling gate is shown in Figure 9.9.
- 278 SIGNAL PROCESSING IN THE TELEPHONE SYSTEM Figure 9.9. The series sampling gate using a FET. The transistor is an open-circuit when the control signal is a 0 and a short-circuit when it is a 1. The output is as shown. 9.3.2.3 Shunt Sampling Gate. The shunt sampling gate is shown in Figure 9.10. The transistor acts as a switch and short-circuits the output when the gate voltage is a 1. When the gate voltage is a 0, it is an open-circuit and a path exists between the input and the output. 9.3.2.4 Series-Shunt Sampling Gate. The two circuits shown above have an inherent deficiency because, when the transistor is on, its source-to-drain impedance is low but not equal to zero. To improve the performance, the action of the two gates can be combined as shown in Figure 9.11. Figure 9.10. The shunt sampling gate.
- 9.3 TIME-DIVISION MULTIPLEX (TDM) 279 Figure 9.11. A combination of the series and shunt sampling gates improves performance. 9.3.2.5 Operational Amplifier Sampling Gate. The circuit is shown in Figure 9.12. The operational amplifier is connected to give a gain of R2 =R1 when the transistor is in the off state. When the transistor is on, R2 is short-circuited and the gain is reduced to unity. 9.3.2.6 Multiplier Sampling Gate. A PAM sampler can be seen as a multi- plication of the analog signal and a train of pulses. The process is illustrated in Figure 9.13. One of the best methods for accomplishing analog multiplication is use the four- quadrant analog multiplier. This circuit was described in Section 2.6.3. A practical integrated circuit realization of this is the MC1595 (four-quadrant multiplier manufactured by Motorola Semiconductor Products, Inc.). 9.3.2.7 The Adder. The adder was discussed in Section 4.4.3.5. 9.3.3 Pulse-Amplitude Modulation Decoder The first step in the recovery of the original three signals is to reverse the action of the commutator by separating them into their respective channels. Low-pass filters Figure 9.12. A sampling gate using an operational amplifier.
- 280 SIGNAL PROCESSING IN THE TELEPHONE SYSTEM Figure 9.13. The multiplier sampling gate illustrates that sampling is equivalent to the multi- plication of two signals. are then used to reconstruct the analog waveform from the PAM pulses. The PAM decoder system is shown in Figure 9.14. The incoming signal is fed into the Schmitt trigger. The trip level of the Schmitt trigger is set so that only the large sync pulse will trigger it. The output of the Schmitt trigger is then used to synchronize an astable multivibrator. The astable multivibrator then runs in synchronism with the master clock in the PAM coder. The output of the astable multivibrator drives a four-phase ring counter which produces four sequential output pulses in synchronism with the ring counter in the encoder. These pulses are used to drive the control gates of the sample-and-hold (S=H) circuits. The incoming signal is also fed to the analog inputs of the sample-and-hold circuits. Since the control gate of only the S=H-1 is open during the period allotted to channel 1, the pulse amplitude of the signal in channel 1 is passed onto S=H-1. The other channels follow in sequence. The low-pass filters remove the high-frequency components of the PAM signals, producing a replica of the original analog signals. 9.3.3.1 Schmitt Trigger Design. The circuit diagram of the Schmitt trigger is shown in Figure 9.15. The circuit is designed so that, with no input, Q1 has no base current and it is therefore off. Q2 is supplied with base current from the resistive chain Rc1 , R1 and R2 and it is therefore on. Current flows in Q2 and with the correct choice of Rc2 , Q2 will
- Figure 9.14. A block diagram of the PAM decoder. Note that in Figure 9.7, the first three channels had a signal and the fourth was used for timing purposes. 281
- 282 SIGNAL PROCESSING IN THE TELEPHONE SYSTEM Figure 9.15. The circuit diagram of the Schmitt trigger. be in saturation. The emitter current of Q2 flows in RE and sets up a voltage VE . If an increasing positive voltage is applied to the input, when it reaches the value VE þ VBE , Q1 will start to conduct. Current is drawn through Rc1 causing the voltage on the base of Q2 to drop. Q2 conducts less vigorously and the voltage across RE tends to drop. But this drop in voltage at the emitter causes the base-emitter voltage of Q1 to increase rapidly. This is a form of regeneration and proceeds very fast, ending with Q1 conducting and in saturation and Q2 cut off. When the input voltage is decreasing, there comes the point when it is slightly below the value VE þ VBE . Q1 conducts less current, causing its collector voltage to tend to rise and its emitter voltage to tend to drop. The rising trend at the collector of Q1 is passed onto the base of Q2 by R1 and C. The combined effect of a decreasing VE and a rising base voltage causes Q2 to switch on regeneratively and go into saturation. The Schmitt trigger reacts to a slowly changing input voltage by producing a voltage step when its trip level is exceeded. This happens for increasing as well as decreasing voltages. The design of the Schmitt trigger is best illustrated by an example. Example 9.3.1 Schmitt Trigger Design. Design a Schmitt trigger circuit so that it triggers when a voltage in excess of 3.0 V is applied at the input. The dc supply voltage is 10 V and two NPN silicon bipolar transistors with b ¼ 100 are provided. VCEðsatÞ ¼ 0:5 V and VBE ¼ 0:7 V. The load driven by the Schmitt trigger requires a current of 1 mA. Solution. The transistors are made of silicon; therefore, VBE ¼ 0:7 V. For the circuit to trigger at 3.0 V, VE must be designed to be equal to ð3:0 À 0:7Þ ¼ 2:3 V. Since the Schmitt trigger is to drive a load that requires 1.0 mA, it is good design practice to
- 9.3 TIME-DIVISION MULTIPLEX (TDM) 283 allow about 10 times this current to flow in the collector of Q2 . Collector current of Q2 is then 10 mA; therefore, the emitter current is also 10 mA, and RE ¼ 2:3=10 kO ¼ 230 O: Since Q2 is in saturation, the collector voltage must be equal to ðVE þ 0:5Þ ¼ ð2:3 þ 0:5Þ ¼ 2:8 V. The voltage drop across Rc2 is ð10:0 À 2:8Þ ¼ 7:2 V. Since 10 mA flows through Rc2 , Rc2 ¼ 7:2=10 kO ¼ 720 O: The base voltage of Q2 must be at the voltage ðVE þ 0:7Þ ¼ ð2:3 þ 0:7Þ ¼ 3:0 V. The base current of Q2 is IB ¼ IC =b ¼ 10=100 mA ¼ 100 mA: To maintain a reasonably stable trigger point, it is necessary to allow about 10 times the base current to flow in the resistive chain Rc1 , R1 and R2 . The current in the resistive chain is therefore 1 mA and its total resistance is 10 V=1 mA ¼ 10 kO. Let R01 be equal to ðRc1 þ R1 Þ so that R01 =R2 ¼ ð10:0 À 3:0Þ=3:0 ¼ 2:33: But R01 þ R2 ¼ 10 kO: Therefore R01 ¼ 7:0 kO and R2 ¼ 3:0 kO: When Q1 is in saturation, it must draw the same current as when Q2 was in saturation, Rc1 ¼ Rc2 ¼ 720 O: Therefore R1 ¼ ð7:0 À 0:72Þ ¼ 6:28 kO: The capacitor C is a speed-up capacitor which helps the transition of Q2 from the on state to the off state. A reasonable value is 50–100 pF. 9.3.3.2 Sample-and-Hold Circuit. The circuit diagram of the ideal S=H circuit is shown in Figure 9.16. The switch S closes and the ideal voltage source charges capacitor C instanta- neously. When S opens, the capacitor retains its charge indefinitely. In practice, S is
- 284 SIGNAL PROCESSING IN THE TELEPHONE SYSTEM Figure 9.16. The ideal sample-and-hold circuit. not an ideal short-circuit when closed and the voltage source has an internal resistance Rs . This means that C charges up with a time-constant t ¼ CRs . So long as the pulse width of the driving source is significantly longer than t the error can be regarded as insignificant. Another practical consideration is that, when S is open, C can lose its charge due to leakage in the dielectric of the capacitor and the finite impedance of the load driven by the S=H. A simple but practical circuit for the S=H is shown in Figure 9.17. The operational amplifiers are connected as voltage followers with a gain of unity. The output impedance of A1 is low enough for it to drive the required charge into the capacitor. The N -channel JFET is switched on by a pulse applied to the gate and the capacitor charges up to the value of the input voltage. When the JFET switch is turned off, the high input impedance of A2 drains minimal current from C. The design of the S=H circuit is best illustrated by an example. Example 9.3.2 Sample-and-Hold Circuit. The S=H circuit shown in Figure 9.17 uses a JFET as a series sampling gate. The voltage follower A2 takes a current of 500 nA. The JFET has a source-to-drain resistance of 25 O when it is in the on state and may be considered to be an open-circuit when it is in the off state. The signal Figure 9.17. A practical sample-and-hold circuit.
- 9.3 TIME-DIVISION MULTIPLEX (TDM) 285 amplitude is 2.0 V, the sample-time is 5 ms and the hold time is 500 ms. The capacitor has a value 0:4 mF. Calculate the error in the output at the end of the hold time. Assume that the signal source has negligible resistance. Solution. When the sampling gate is closed, assume that the current flowing into the capacitor i ) 550 nA (the leakage current taken by A2 ): t ¼ CRs ¼ 25 Â 0:4 Â 10À6 s: ð9:3:1Þ For the RC circuit shown in Figure 9.18, vc ¼ Vs ð1 À eÀt=t Þ: ð9:3:2Þ When t ¼ 5 ms, and Vs ¼ 2:0 V, vc ¼ 1:987 V. Charge on C at t1 ¼ 5 ms, Q ¼ CvC ¼ 0:4 Â 10À6 Â 1:987 ¼ 0:795 mC: ð9:3:3Þ Charge lost by C in time t2 ¼ 500 ms, DQ ¼ I Dt ¼ 500 Â 10À9 Â 500 Â 10À6 ¼ 25 Â 10À11 C: ð9:3:4Þ Charge on C at time t2 , Q À DQ ¼ ð0:795 Â 10À6 À 25 Â 10À11 Þ ¼ 0:794 Â 10À6 C: ð9:3:5Þ Voltage across C at time t2 , Q À DQ vc2 ¼ ¼ 1:986V ð9:3:6Þ C Percentage error in the output is 1.4%. 9.3.3.3 Other Circuit Blocks in the Decoder. The synchronized astable multivibrator was discussed in Section 7.2.7.3 and the ring counter in Section 9.3.2.1. The design of the filters is beyond the scope of this book. Figure 9.18. The RC circuit for the Example 9.3.2 showing the exponential response.
- 286 SIGNAL PROCESSING IN THE TELEPHONE SYSTEM 9.3.4 Pulse Code Modulation Encoder=Multiplexer As mentioned earlier signals coded in PAM tend to be susceptible to corruption by noise and circuit non-linearities since the information is contained in the amplitude of the pulses. Greater noise immunity can be obtained if the amplitude of the pulse is coded in binary form. In the presence of noise and other forms of pulse degradation it is much easier for the receiver to distinguish between the presence (1) or absence (0) of a pulse as opposed to the height of a pulse. PCM is the preferred technique in all modern telephone systems. To illustrate the basic principles of the design, a four-channel PCM carrier system has been chosen and it is shown in Figure 9.19(a). The four voice channels are sampled in sequence so the sampler output is a time-division multiplexed PAM signal. The PCM encoder converts the amplitude of each of the four samples into an eight-bit binary code. Figure 9.19(b) shows the sampled analog signals in the four- channel system, the interleaved PAM samples, and the PCM output. The 32 (4 Â 8) bits are transmitted over a twisted-pair telephone wire. One bit (frame bit) is added for synchronization purposes; it may be wider than the other pulses or it may have a specially coded sequence of 1s and 0s which can be easily recognized by the receiver. Comparing Figures 9.7 and 8.34 with Figure 9.19 shows that the PCM is a PAM system feeding into the coder of the codec (A=D followed by a P=S converter). The design of the ring counter and the sampling gates were discussed in Section 9.3.2. The A=D and P=S converters were discussed in Section 8.5.1. 9.3.5 Pulse-Code Modulation Decoder=Demultiplexer The system diagram of the decoder=demultiplexer is shown in Figure 9.20. The frame bit extractor is designed to recognize the frame bit and send out a pulse to synchronize the local oscillator to the master oscillator in the PCM encoder. The output of the local oscillator is used to drive the S=P converter, the A=D converter, and the four-phase ring counter. The output from the D=A converter and the ring counter are fed to the S=H circuits. If the timing is correct, the decoder reconstructs the four samples from the eight-bit codes. The circuit assigns each sample to its correct channel (demultiplex) and the outputs of the low-pass filters follow the envelope of the PAM signal, producing a replica of the original audio-frequency signal. Comparing Figures 8.34 and 9.14 with Figure 9.20 shows that the de- coder=demultiplexer is, in fact, the decoder of the codec followed by the PAM demultiplexer. The design of the S=P and D=A converters was discussed in Sections 9.5.1.5 and 9.5.1.1, respectively. The design of the circuit components for the PAM demultiplexer was discussed in Section 9.3.3. 9.3.6 Bell System T-1 PCM Carrier The Bell T-1 carrier system uses an eight-bit PCM in 24 voice-channel banks. The sampling rate is 8 kHz. The number of bits generated for one scan of the channels
CÓ THỂ BẠN MUỐN DOWNLOAD


Chịu trách nhiệm nội dung:
Nguyễn Công Hà - Giám đốc Công ty TNHH TÀI LIỆU TRỰC TUYẾN VI NA
LIÊN HỆ
Địa chỉ: P402, 54A Nơ Trang Long, Phường 14, Q.Bình Thạnh, TP.HCM
Hotline: 093 303 0098
Email: support@tailieu.vn
Giấy phép Mạng Xã Hội số: 670/GP-BTTTT cấp ngày 30/11/2015 Copyright © 2022-2032 TaiLieu.VN. All rights reserved.

