


Báo cáo hóa học: " High expression of transcriptional coactivator p300 correlates with aggressive features and poor prognosis of hepatocellular carcinoma"
lượt xem 5
download
 Download
Vui lòng tải xuống để xem tài liệu đầy đủ
Download
Vui lòng tải xuống để xem tài liệu đầy đủ
Tuyển tập báo cáo các nghiên cứu khoa học quốc tế ngành hóa học dành cho các bạn yêu hóa học tham khảo đề tài: High expression of transcriptional coactivator p300 correlates with aggressive features and poor prognosis of hepatocellular carcinoma
Bình luận(0) Đăng nhập để gửi bình luận!
Nội dung Text: Báo cáo hóa học: " High expression of transcriptional coactivator p300 correlates with aggressive features and poor prognosis of hepatocellular carcinoma"
- Li et al. Journal of Translational Medicine 2011, 9:5 http://www.translational-medicine.com/content/9/1/5 RESEARCH Open Access High expression of transcriptional coactivator p300 correlates with aggressive features and poor prognosis of hepatocellular carcinoma Mei Li1,2†, Rong-Zhen Luo1,2†, Jie-Wei Chen1,2, Yun Cao1,2, Jia-Bin Lu1,2, Jie-Hua He1,2, Qiu-Liang Wu1,2, Mu-Yan Cai1,2* Abstract Background: It has been suggested that p300 participates in the regulation of a wide range of cell biological processes and mutation of p300 has been identified in certain types of human cancers. However, the expression dynamics of p300 in hepatocellular carcinoma (HCC) and its clinical/prognostic significance are unclear. Methods: In this study, the methods of reverse transcription-polymerase chain reaction (RT-PCR), Western blotting and immunohistochemistry (IHC) were utilized to investigate protein/mRNA expression of p300 in HCCs. Receiver operating characteristic (ROC) curve analysis, spearman’s rank correlation, Kaplan-Meier plots and Cox proportional hazards regression model were used to analyze the data. Results: Up-regulated expression of p300 mRNA and protein was observed in the majority of HCCs by RT-PCR and Western blotting, when compared with their adjacent non-malignant liver tissues. According to the ROC curves, the cutoff score for p300 high expression was defined when more than 60% of the tumor cells were positively stained. High expression of p300 was examined in 60/123 (48.8%) of HCCs and in 8/123 (6.5%) of adjacent non- malignant liver tissues. High expression of p300 was correlated with higher AFP level, larger tumor size, multiplicity, poorer differentiation and later stage (P < 0.05). In univariate survival analysis, a significant association between overexpression of p300 and shortened patients’ survival was found (P = 0.001). In different subsets of HCC patients, p300 expression was also a prognostic indicator in patients with stage II (P = 0.007) and stage III (P = 0.011). Importantly, p300 expression was evaluated as an independent prognostic factor in multivariate analysis (P = 0.021). Consequently, a new clinicopathologic prognostic model with three poor prognostic factors (p300 expression, AFP level and vascular invasion) was constructed. The model could significantly stratify risk (low, intermediate and high) for overall survival (P < 0.0001). Conclusions: Our findings provide a basis for the concept that high expression of p300 in HCC may be important in the acquisition of an aggressive phenotype, suggesting that p300 overexpression, as examined by IHC, is an independent biomarker for poor prognosis of patients with HCC. The combined clinicopathologic prognostic model may become a useful tool for identifying HCC patients with different clinical outcomes. Background prevalence of chronic hepatitis B virus and hepatitis C Hepatocellular carcinoma (HCC) is the fifth most com- virus infections, and recently its incidence in the United mon cancer in the world and the third leading cause of States and in Western Europe has been increasing [2,3]. cancer mortality [1]. It is among the top three causes of Despite new therapies and attempts for early detection cancer death in the Asian Pacific region due to the high of primary HCC, the long-term survival of HCC patient remains poor. Surgery is considered as one of the stan- dard curative treatments for HCC if the tumor is resect- * Correspondence: caimuyan@hotmail.com † Contributed equally able [4]. However, the prognosis of HCC patients with 1 State Key Laboratory of Oncology in South China, Sun Yat-Sen University the same clinical stage often differs substantially in spite Cancer Center, Guangzhou, PR China Full list of author information is available at the end of the article © 2011 Li et al; licensee BioMed Central Ltd. This is an Open Access article distributed under the terms of the Creative Commons Attribution License (http://creativecommons.org/licenses/by/2.0), which permits unrestricted use, distribution, and reproduction in any medium, provided the original work is properly cited.
- Li et al. Journal of Translational Medicine 2011, 9:5 Page 2 of 11 http://www.translational-medicine.com/content/9/1/5 of curative surgical resection and such large variation is on distinctive pathologic diagnosis of HCC, undergoing mostly unexplained. Thus, a large amount of investiga- primary and curative resection for tumor without preo- tions on HCC have focused on the discovery of specific perative anticancer treatment, availability of resection molecular markers that could serve as reliable prognos- tissue and follow-up data. These HCC cases included tic factors. To date, however, the search for specific 107 (87.0%) men and 16 (13.0%) women, with mean age molecules in HCC cells that have clinical/prognostic of 47.7 years. Average follow-up time was 26.79 months value remains substantially limited. (median, 28.0 months; range, 1.0 to 61 months). Recently, it has been reported that p300, a member of Patients whose cause of death remained unknown the histone acetyltransferase family of transcriptional were excluded from our study. Clinicopathologic charac- coactivator, is found to play a variety of roles in the teristics for these patients including age, sex, hepatitis transcription process and catalyzes histone acetylation history, alpha-fetoprotein (AFP), liver cirrhosis, tumor through its histone acetyltransferase activity [5,6]. Tran- number, size, differentiation, stage, vascular invasion scriptional coactivator p300 has been shown to partici- and relapse were detailed in Table 1. Tumor differentia- pate in the regulation of various cellular processes such tion was based on the criteria proposed by Edmonson as proliferation, differentiation, apoptosis, cell-cycle reg- and Steiner [16]. Tumor stage was defined according to ulation and DNA damage response [7]. A tumor sup- American Joint Committee on Cancer/International pressor role of p300 has been identified in certain types Union Against Cancer tumor-node-metastasis (TNM) of human cancers, including breast, colorectal and gas- classification system [17]. Institute Research Medical tric carcinoma [8,9]. However, several studies suggest Ethics Committee of Sun Yat-Sen University Cancer that transcriptional coactivator p300 is a positive regula- Center granted approval for this study. tor of cancer progression and related to tumorigenesis of various human cancers [10,11]. The translational co- RT-PCR activator p300 was found to be involved in the integrin Total RNA was isolated from 8 pairs of HCC tissues beta-1-mediated histone acetylation and p21 transcrip- and adjacent non-malignant liver tissues using TRIZOL tional activation in HCC [12]. In addition, Wang et al reagent (Invitrogen, Carlsbad, CA). RNA was reverse- [13] suggested that a direct role of phosphor-CREB in transcribed using SuperScript First Strand cDNA System p300 and Brg I recruitment to the Hulc promoter led to (Invitrogen, Carlsbad, CA) according to the manufac- ture’s instructions. PCR was performed as described pre- the activation of epigenetic markers and chromatin remodeling at the same location in hepatic cancer cells. viously using specific primers for p300 [18]. The It has also been reported that p300 expression correlates expression of GAPDH was monitored as a control. with nuclear alterations of tumor cells and contributes to the growth of prostate carcinoma and is a predictor Western blotting analysis of aggressive features of this cancer [14,15]. Equal amounts of whole cell and tissue lysates were Up to date, the clinicopathologic/prognostic implica- resolved by SDS-polyacrylamide gel electrophoresis tion of p300 in HCC has not been explored. In this (PAGE) and electrotransferred on a polyvinylidene study, reverse transcription-polymerase chain reaction difluoride (PVDF) membrane (Pall Corp., Port Washing- (RT-PCR), Western blotting, immunohistochemistry ton, NY). The tissues were then incubated with primary (IHC) and tissue microarray were utilized to examine mouse monoclonal antibodies against human anti-p300 (Abcam, Cambridge, MA) at a concentration of 0.5 μg/ the distribution and frequency of p300 expression in our HCC cohort and adjacent non-malignant liver tissues. In ml. The immunoreactive signals were detected with order to avoid predetermined cutpoint, receiver operat- enhanced chemiluminescence kit (Amersham Bios- ing characteristic (ROC) curve analysis was employed to ciences, Uppsala, Sweden). The procedures followed were conducted in accordance with the manufacturer’s define the cutoff score for high expression of p300. In addition, the correlation between p300 expression and instructions. cell proliferation levels in our HCCs was analyzed using the Ki-67 assessment marker. Tissue microarray (TMA) construction Tissue microarray was constructed as the method Methods described previously [19]. In brief, formalin-fixed, paraf- fin-embedded tissue blocks and the corresponding Patients and tissue specimens In this study, the paraffin-embedded pathologic speci- H&E-stained slides were overlaid for TMA sampling. mens from 123 patients with HCC were obtained from The slides were reviewed by a senior pathologist (M-Y. the archives of Department of Pathology, Sun Yat-Sen C.) to determine and mark out representative tumor University Cancer Center, Guangzhou, China, between areas. Triplicates of 0.6 mm diameter cylinders were July 2005 and May 2008. The cases selected were based punched from representative tumor areas and from
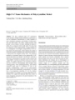
- Li et al. Journal of Translational Medicine 2011, 9:5 Page 3 of 11 http://www.translational-medicine.com/content/9/1/5 Table 1 Correlation of p300 expression with patients’ The TMA block contained 126 HCCs and adjacent non- clinicopathologic features in primary hepatocellular malignant liver tissues. carcinomas Immunohistochemistry (IHC) p300 protein P The TMA slides were dried overnight at 37°C,deparaffi- Variable All Low High valuea cases expression expression nized in xylene, rehydrated through graded alcohol, immersed in 3% hydrogen peroxide for 20 minutes to Age (years) 0.267 ≤ 47.7b block endogenous peroxidase activity, and antigen- 59 28 (47.5%) 31 (52.5%) retrieved by pressure cooking for 3 minutes in ethylene- >47.7 64 35 (54.7%) 29 (45.3%) diamine tetraacetic acid (EDTA) buffer (pH = 8.0). Then Sex 0.564 the slides were preincubated with 10% normal goat Male 107 55 (51.4%) 52 (48.6%) serum at room temperature for 30 minutes to reduce Female 16 8 (50.0%) 8 (50.0%) nonspecific reaction. Subsequently, the slides were incu- Etiology 0.295 bated with mouse monoclonal anti-p300 (Abcam, Cam- HBV 97 48 (49.5%) 49 (50.5%) bridge, MA) at a concentration of 3 ng/ml and mouse HCV 8 3 (37.5%) 5 (62.5%) monoclonal anti-Ki-67 (Zymed Laboratories Inc., South None 18 12 (66.7%) 6 (33.3%) San Francisco, CA, 1:100 dilution) for 2 hours at room AFP (ng/ml) 0.000 ≤ 20 temperature. The slides were sequentially incubated 68 46 (67.6%) 22 (32.4%) with a secondary antibody (Envision; Dako, Glostrup, >20 55 17 (30.9%) 38 (69.1%) Denmark) for 1 hour at room temperature, and stained Liver cirrhosis 0.334 with DAB (3,3-diaminobenzidine). Finally, the sections Yes 87 47 (54.0%) 40 (46.0%) were counterstained with Mayer’s hematoxylin, dehy- No 36 16 (44.4%) 20 (55.6%) drated, and mounted. A negative control was obtained Tumor size (cm) 0.000 ≤5 by replacing the primary antibody with a normal murine 76 50 (65.8%) 26 (34.2%) IgG. Known immunostaining positive slides were used >5 47 13 (27.7%) 34 (72.3%) as positive controls. Tumor multiplicity 0.012 Single 85 50 (58.8%) 35 (41.2%) Multiple 38 13 (34.2%) 25 (65.8%) IHC evaluation Nuclear immunoreactivity for p300 protein was reported Differentiation 0.036 in semi-quantitative method by evaluating the number Well 15 12 (80.0%) 3 (20.0%) of positive tumor cells over the total number of tumor Moderate 70 36 (51.4%) 34 (48.6%) cells. Scores were assigned by using 5% increments (0%, Poor 32 14 (43.8%) 18 (56.3%) 5%, 10%-100%). Expression for p300 was scored by 3 Undifferentiated 6 1 (16.7%) 5 (83.3%) independent pathologists (M. L., R-Z. L. and M-Y. C.) Stage 0.015 blinded to clinicopathologic data. Their conclusions I 12 10 (83.3%) 2 (16.7%) were in complete agreement in 82.1% of the cases, II 49 27 (55.1%) 22 (44.9%) which identified this scoring method as highly III 48 23 (47.9%) 25 (52.1%) reproducible. IV 14 3 (21.4%) 11 (78.6%) Vascular invasion 0.130 Yes 55 24 (43.6%) 31 (56.4%) Selection of Cutoff Score ROC curve analysis was employed to determine cutoff No 68 39 (57.4%) 29 (42.6%) score for tumor “ high expression ” by using the 0,1- Relapse 0.182 criterion [20]. At the p300 score, the sensitivity and spe- Yes 42 18 (42.9%) 24 (57.1%) cificity for each outcome under study was plotted, thus No 81 45 (55.6%) 36 (44.4%) generating various ROC curves (Figure 1). The score Ki67 expression 0.002 was selected as the cutoff value, which was closest to Low 68 44 (64.7%) 24 (35.3%) the point with both maximum sensitivity and specificity. High 50 18 (36.0%) 32 (64.0%) Tumors designated as “low expression” for p300 were a Chi-square test; bMean age; HBV, hepatitis B virus; HCV, hepatitis B virus; AFP, alpha-fetoprotein. those with scores below or equal to the cutoff value, while “high expression” tumors were those with scores above the value. In order to use ROC curve analysis, the adjacent non-malignant liver tissue of individual donor clinicopathologic features were dichotomized: AFP level tissue block and re-embedded into a recipient paraffin (≤ 20 ng/ml or >20 ng/ml), tumor size (≤ 5 cm or >5 block at defined position, using a tissue arraying cm), tumor multiplicity (single or multiple), tumor instrument (Beecher Instruments, Silver Spring, MD).
- Li et al. Journal of Translational Medicine 2011, 9:5 Page 4 of 11 http://www.translational-medicine.com/content/9/1/5 Figure 1 ROC curve analysis was created to determine the cutoff score for high expression of p300 protein . The sensitivity and specificity for each outcome were plotted: AFP level (A.), tumor size (B.), tumor multiplicity (C.), tumor differentiation (D.), clinical stage (E.), vascular invasion (F.), tumor relapse(G.). grade (well-moderately or poorly-undifferentiated), stage the Kaplan-Meier method. Predictive accuracy was (I + II or III + IV), vascular invasion (absence or pre- quantified using the Harrell concordance index. Differ- ences were considered significant if the P-value from a sence), relapse (absence or presence) and survival status (death due to HCC or censored). two-tailed test was
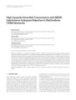
- Li et al. Journal of Translational Medicine 2011, 9:5 Page 5 of 11 http://www.translational-medicine.com/content/9/1/5 Figure 2 The mRNA and protein expression of p300 in HCC and adjacent non-malignant liver tissues. A. Up-regulated expression of p300 mRNA was examined by RT-PCR in 3/4 HCC cases, when compared with adjacent non-malignant liver tissues. B. Up-regulated expression of p300 protein was detected by Western blotting in 4/4 HCC cases, when compared with adjacent non-malignant liver tissues. C. High expression of p300 was observed in a HCC (case 26), in which more than 90% tumor cells revealed positive immunostaining of p300 in nuclei (upper panel, × 100). D. A HCC case (case 81) demonstrated low expression of p300, in which less than 50% of tumor cells showed immunoreactivity of p300 protein in nuclei (upper panel, × 100). E. Nearly negative expression of p300 protein was demonstrated in a HCC case (case 57, upper panel, × 100). F. The adjacent non-malignant liver tissues of HCC case 26 showed nearly negative expression of p300 protein (upper panel, × 100). The lower panels indicated the higher magnification (× 400) from the area of the box in C., D., E. and F., respectively. t issues (Figure 2A). Up-regulated expression of p300 60% was defined as high expression, while below or protein was observed in 6/8 (75.0%) HCCs, and in each equal to the cutoff value was considered as low expres- of the four cases with up-regulated p300 protein, up- sion. In this study, 16 of the 123 (13.0%) HCC samples regulated p300 mRNA was observed (Figure 2B). showed completely negative staining of p300. High expression of p300 could be detected in 60/123 (48.8%) of HCCs, in 6/87 (6.9%) of adjacent liver tissues with The expression of p300 in HCC and adjacent non- cirrhosis and in 2/36 (5.6%) of adjacent normal liver tis- malignant liver tissues by IHC sues without cirrhosis, respectively (P < 0.0001, Fisher’s For p300 IHC staining in HCCs and adjacent non- malignant liver tissues, immunoreactivity was primarily exact test). observed in the nuclei within tumor cells (Figure 2C). p300 expression could be evaluated informatively in 123 Selection of cutoff scores for p300 expression HCCs by the TMA constructed previously. The non- The ROC curves for each clinicopathological parameter informative 3 TMA samples included samples with too (Figure 1) clearly show the point on the curve closest to few tumor cells (
- Li et al. Journal of Translational Medicine 2011, 9:5 Page 6 of 11 http://www.translational-medicine.com/content/9/1/5 differentiate the outcome of stage I (not reached) or Table 2 Area under the curve (AUC) of receiver operating stage IV patients (P = 0.166, Figure 4D). characteristic curve for each clinicopathologic feature P value Variable AUC (95% CI) Independent prognostic factors of HCC: Multivariate Cox AFP 0.662 (0.563 to 0.760) 0.002 regression analysis Tumor size 0.703 (0.606 to 0.800) 0.000 Since features observed to have a prognostic influence Tumor multiplicity 0.633 (0.525 to 0.741) 0.019 by univariate analysis may covariate, p300 expression Differentiation 0.634 (0.536 to 0.732) 0.010 and those clinicopathologic variables that were signifi- Stage 0.609 (0.505 to 0.713) 0.044 cant in univariate analysis (i.e., AFP levels, tumor size, Vascular invasion 0.544 (0.441 to 0.647) 0.407 tumor multiplicity, clinical stage, vascular invasion, and Relapse 0.466 (0.357 to 0.576) 0.543 relapse) were further examined in multivariate analysis. CI indicates confidence interval. Results showed that high expression of p300 was an independent prognostic factor for poor patient overall survival (hazard ratio, 2.077; 95%CI, 1.149-4.112, P = t o the greatest number of tumors classified based on 0.021; Table 3). Of the other parameters, serum AFP clinical outcome presence or absence. The correspond- level (P = 0.014) and vascular invasion (P = 0.015) were ing area under the curve (AUC, 95% CI) were collected evaluated as well independent prognostic factors for and listed in Table 2. Cutoff score for p300 high expres- patients’ overall survival. sion was determined to be more than 60% carcinoma cells staining. Prognostic model with p300 expression, AFP level and Association of p300 expression with HCC patients’ vascular invasion According to the results of our univariate and multivari- clinicopathological parameters ate analyses, we proposed a new clinicopathologic prog- The high or low expression rates of p300 in HCCs with nostic model with three poor prognostic factors: p300 respect to several standard clinicopathologic features are expression, AFP level and vascular invasion. Thus, we presented in Table 1. The high p300 expression rate was higher in patients with higher AFP levels (P < 0.0001), designated a high-risk group as the presence of the larger tumor size (P < 0.0001), tumor multiplicity (P = three factors (including p300 expression, AFP level and 0.012), poorer differentiation (P = 0.036, Table 1, Figure vascular invasion), an intermediate-risk group as the 3) and later stage (P = 0.015, Table 1). There was no sig- presence of two factor (regardless of their identity), and a low-risk group as the presence of one factor or none. nificant correlation between p300 expression and other clinicopathologic parameters, such as patient age (≤47.7 The model could significantly stratify risk (low, inter- years vs >47.7 years), sex, hepatitis history, liver cirrhosis, mediate and high) for overall survival based upon a tumor vascular invasion and relapse (P > 0.05, Table 1). combination of p300 and the standard clinicopathologic features (P < 0.0001, Figure 4E). In addition, application of Harrell concordance index to the proposed new clini- Relationship between clinicopathologic features, p300 expression, and HCC patients’ survival: Univariate survival copathologic prognostic model showed improved predic- tive ability when compared with the standard analysis pathological feature model (c indexes of 0.689 vs 0.648, In order to confirm the representativeness of the HCCs respectively). in our study, we analyzed established prognostic factors of patients’ survival. Kaplan-Meier analysis demonstrated Correlation between p300 expression and cell a significant impact of well-known clinicopathologic prognostic parameters, such as serum AFP levels (P < proliferation in HCCs 0.0001), tumor size (P < 0.0001), tumor multiplicity (P < To address whether or not p300 expression in HCC is 0.0001), clinical stage (P < 0.0001), vascular invasion (P correlated with cell proliferation, the expression of Ki- < 0.0001), and relapse (P < 0.0001) on patients’ survival 67, a widely used cellular proliferation marker, was investigated by IHC in our HCC cohort. Among the 123 (Table 3). Assessment of survival in total HCCs revealed HCCs, in 118 samples, p300 and Ki-67 IHC were exam- that high expression of p300 was correlated with adverse disease-specific survival of HCC patients ( P = 0.001, ined successfully and simultaneously. According to the ROC curve analysis, the cutoff score for Ki67 high Table 3, Figure 4A). Further analysis was performed expression was determined to be more than 50% carci- with regard to p300 expression in subsets of patients noma cells staining (data not shown). Using this desig- with different stages. The results demonstrated as well nation, high expression of Ki67 was detected in 50/118 that high expression of p300 was a prognostic factor in HCC patients with stage II (P = 0.007, Figure 4B) and (42.4%) HCCs. In addition, a significant positive correla- stage III (P = 0.011, Figure 4C). However, it could not tion between expression of p300 and Ki67 was evaluated
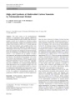
- Li et al. Journal of Translational Medicine 2011, 9:5 Page 7 of 11 http://www.translational-medicine.com/content/9/1/5 Figure 3 The altered expression levels of p300 in HCC tissues by immunohistochemistry. A. and B. represented H&E staining for well- differentiated HCC (case 43) and poorly-differentiated HCC (case 37), respectively. C. Low expression of p300 was observed in a well- differentiated HCC case (case 43), in which less than 5% of tumor cells showed immunoreactivity of p300 protein in nuclei (×100). D. High expression of p300 was demonstrated in the poor-differentiated HCC case (case 37), in which more than 60% carcinoma cells showed immunoreactivity of p300 in nuclei (×100). Representative sites in HCC tissue with higher (inset, ×400) magnification were shown. i n our HCC cohort, in which the frequency of cases tissues and adjacent non-malignant liver tissues. Our with high expression of Ki67 was significantly larger in IHC results demonstrated that high expression of p300 carcinomas with a high expression of p300 (32/56 cases, was more frequently observed in HCC tissues when 57.1%) than in those cases with a low expression of compared to the adjacent liver tissues with or without p300 (18/62 cases, 29.0%) (P = 0.002, Table 1). cirrhosis. The expression of p300 in adjacent non-malig- nant liver tissues with or without cirrhosis was either Discussion absent or at low levels. In contrast, in large number of Transcriptional coactivator p300 has the potential to our HCC tissues, high expression of p300 was frequently participate in a variety of cellular functions, such as cell observed. Previous studies also described that mutation in p300 gene, accompanied by loss of the other allele, proliferation and differentiation, senescence and apopto- sis [7]. Recently several studies have documented an was observed in certain types of tumors, including col- involvement of p300 in oncogenic processes, such as orectal, gastric and breast cancers [8,9]. In addition, the frequency of promoter methylation of p300 gene was lung, colon, prostate, breast cancer and leukemia [14,21-24]. However, the status of p300 and its potential found in 65.8% of HCC [25]. These findings provide evi- prognostic impact on HCC have not been explored so dence that the up-regulation of p300 may play an far. In the present study, we examined the expression important role in tumorigenic process of HCC. levels of p300 mRNA and p300 protein in HCC tissues To assess the significance of p300 protein in HCC and adjacent non-malignant liver tissues, firstly by RT- and avoid predetermined arbitrary cutpoint, ROC PCR and Western blotting. Our results established that curve analysis was applied to determine cutoff score up-regulated expression of p300 mRNA and p300 pro- for p300 expression as described in our previous study tein was shown in the majority of HCCs, when com- [19]. Further correlation analysis revealed that high pared with their adjacent non-malignant liver tissues. expression of p300 in HCCs was correlated with higher Subsequently, the expression dynamics of p300 protein serum AFP levels, larger tumor size, tumor multipli- was investigated by IHC, using a TMA containing HCC city, poorer differentiation and later clinical stage.
- Li et al. Journal of Translational Medicine 2011, 9:5 Page 8 of 11 http://www.translational-medicine.com/content/9/1/5 Table 3 Univariate and multivariate analysis of different prognostic factors in 123 patients with hepatocellular carcinoma (Cox Proportional Hazards Regression) Univariate analysis Multivariate analysis P value P value Variable All cases HR (95% CI) HR (95% CI) Age (years) 0.883 ≤47.9a 59 1.0 >47.9 64 1.044 (0.588-1.853) Sex 0.746 Male 107 1.153 (0.489-2.717) Female 16 1.0 Hepatitis history 0.806 Yes 105 0.904 (0.405-2.021) No 18 1.0 AFP (ng/ml) 0.000 0.014 ≤20 68 1.0 1.0 >20 55 5.445 (2.852-10.395) 2.573 (1.209-5.476) Liver cirrhosis 0.807 Yes 87 1.0 No 36 1.082 (0.578-2.026) Tumor size (cm) 0.000 0.167 ≤5 76 1.0 1.0 >5 47 2.946 (1.640-5.290) 1.595 (0.823-3.090) Tumor multiplicity 0.000 0.077 Single 85 1.0 1.0 Multiple 38 3.768 (2.108-6.735) 1.790 (0.939-3.414) Differentiation 0. 099 Well-moderate 85 1.0 Poor-undifferentiated 38 1.642 (0.911-2.958) Stage 0.000 0.363 I-II 61 1.0 1.0 III -IV 62 5.828 (2.722-12.480) 1.571 (0.593-4.162) Vascular invasion 0.000 0.015 Yes 55 5.372 (2.724-10.595) 2.724 (1.214-6.113) No 68 1.0 1.0 Relapse 0.000 0.321 Yes 42 2.885 (1.608-5.174) 1.390 (0.725-2.666) No 81 1.0 1.0 p300 0.001 0.021 Low expression 63 1.0 1.0 High expression 60 2.792 (1.533-5.087) 2.077 (1.149-4.112) Ki67 0.089 Low expression 68 1.0 High expression 50 1.661 (0.925-2.982) a Mean age; AFP, alpha-fetoprotein; HR, hazards ratio; CI, confidence interval. Importantly, high expression of p300 was a strong and found statistically significant correlation for these independent predictor of shortened overall survival as HCC-subgroups in univariate analysis. Our findings in evidenced by univariate and multivariate analysis. In this study suggest that expression of p300 in HCC may addition, stratified survival analysis of HCC accordingly facilitate an increased malignant feature and/or worse to clinical stage evaluated p300 expression to be clo- prognosis of this tumor. Previous study also suggested that sely correlated with survival of HCC patients with putative p300 and CREB complex might up-regulate the stage II or stage III. Since a relatively less cases of H3 and H4 acetylation levels, and then up-regulated HCC were included in stage I or stage IV, we did not the Hulc expression level which was identified as the
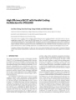
- Li et al. Journal of Translational Medicine 2011, 9:5 Page 9 of 11 http://www.translational-medicine.com/content/9/1/5 Figure 4 Kaplan-Meier survival analysis of p300 expression in total patients and subsets of different stage patients with HCC (log-rank test). A. Total, probability of survival of all patients with HCC: low expression, n = 63; high expression, n = 60. B. Stage II, probability of survival of stage II patients with HCC: low expression, n = 27; high expression, n = 22. C. Stage III, probability of survival of stage III patients with HCC: low expression, n = 23; high expression, n = 25. D. Stage IV, probability of survival of stage IV patients with HCC: low expression, n = 3; high expression, n = 11. E. Comparison of overall survival according to a new combined clinicopathologic prognostic model (including p300, AFP level and vascular invasion): low risk, n = 70; intermediate risk, n = 29; high risk, n = 24. most important genes in HCC [13]. Thus, the exami- Although several characteristics of CBP and p300 sug- nation of p300 expression by IHC could be used as an gested that these proteins might serve as tumor suppres- additional tool in identifying those patients at risk of sors, some studies reported an important role of p300 HCC progression; p300 expression analysis may also protein in oncogenic processes [7,26]. In prostate be useful in optimizing individual HCC therapy man- cancer, p300 expression was shown to be linked to agement: favoring a more aggressive regimen in tumors proliferation and identified as a predictor of progression with a high expression of p300. of this cancer [14]. In colon carcinoma, overexpression
- Li et al. Journal of Translational Medicine 2011, 9:5 Page 10 of 11 http://www.translational-medicine.com/content/9/1/5 of p300 was an indicator of poor prognosis [21]. More- acquisition of an aggressive phenotype in HCC, suggest- over, p300 mRNA levels were observed to correlate with ing that the expression of p300, as examined by IHC, lymph node status in breast cancer [24]. However, p300 will be a promising independent biomarker for shor- protein levels did not show significant correlations with tened survival time of HCC patients. The combined tumor grade or nodal positivity in other study [27,28]. clinicopathologic prognostic model may become a useful In the present study, we did observe that high expres- tool for identifying patients with different clinical sion of p300 was associated with an aggressive feature outcomes. of HCC and was a strong and independent predictor of shorter cancer-specific survival. Considering that the Abbreviations mechanism by which coactivator p300 promotes gene AFP: alpha-fetoprotein; AUC: area under the curve; CBP: CREB binding transcription may vary among gene targets, it is not very protein; CREB: cAMP response element binding protein; HCC: hepatocellular carcinoma; Hulc: highly up-regulated in liver cancer; IHC: difficult for us to understand that the function of p300 immunohistochemistry; ROC: receiver operating characteristic; TMA: tissue and its underling mechanism(s) to impact cancer pro- microarray. gression may lead to this discrepancy. In addition, Acknowledgements although we observed a positive association of p300 This study was supported by grant from the Nature Science Foundation of expression and Ki-67 expression (a marker for cell pro- China (No.30901709). liferation) in our HCC cohort, the precise signaling Author details pathway that is ultimately involved in these processes 1 State Key Laboratory of Oncology in South China, Sun Yat-Sen University remains to be investigated. However, our findings sug- Cancer Center, Guangzhou, PR China. 2Department of Pathology, Sun Yat- gest a potential important role of p300 in the control of Sen University Cancer Center, Guangzhou, PR China. HCC cell proliferation, an activity that might be respon- Authors’ contributions sible, at least in part, for HCC tumorigenesis and/or MYC is responsible for the study design. ML and RZL performed the progression. experiments and draft the manuscript. JWC, JBL YC, JHH and QLW participated in the data analysis and interpretation. All authors read and Since advanced pTNM stage and tumor differentiation approved the final manuscipt. are the best-established risk factors for important aspects affecting the prognosis of patients with HCC Competing interests The authors declare that they have no competing interests. [29]. These 2 parameters, based on specific clinicopatho- logic features and extent of disease, may have reached Received: 24 September 2010 Accepted: 5 January 2011 their limits in providing critical information influencing Published: 5 January 2011 patient prognosis and treatment strategies. Furthermore, References outcome of patients with same stage following surgery is 1. Lau WY, Lai EC, Lau SH: The current role of neoadjuvant/adjuvant/ substantially different and such large discrepancy has chemoprevention therapy in partial hepatectomy for hepatocellular not been explored [30,31]. Thus, there is a need for new carcinoma: a systematic review. Hepatobiliary Pancreat Dis Int 2009, 8:124-133. objective strategies that can effectively distinguish 2. Jemal A, Siegel R, Ward E, Hao Y, Xu J, Thun MJ: Cancer statistics, 2009. CA between patients with favorable and unfavorable prog- Cancer J Clin 2009, 59:225-249. nosis. In this study, our results support the ideas that 3. Cabibbo G, Craxi A: Epidemiology, risk factors and surveillance of hepatocellular carcinoma. Eur Rev Med Pharmacol Sci 14:352-355. p300 expression, as examined by IHC, can identify 4. Frau M, Biasi F, Feo F, Pascale RM: Prognostic markers and putative patients with HCC that may show aggressive clinical therapeutic targets for hepatocellular carcinoma. Mol Aspects Med course and poor outcome. Therefore, evaluation of p300 31:179-193. 5. Kundu TK, Palhan VB, Wang Z, An W, Cole PA, Roeder RG: Activator- expression may become a biomarker for predicting dependent transcription from chromatin in vitro involving targeted prognosis and rendering a more tailored treatment strat- histone acetylation by p300. Mol Cell 2000, 6:551-561. egy in patients with HCC. Based on the results, we 6. Vo N, Goodman RH: CREB-binding protein and p300 in transcriptional regulation. J Biol Chem 2001, 276:13505-13508. propose a new prognostic model with high p300 7. Goodman RH, Smolik S: CBP/p300 in cell growth, transformation, and expression, AFP levels and vascular invasion. This development. Genes Dev 2000, 14:1553-1577. model including p300 expression can reflect the 8. Muraoka M, Konishi M, Kikuchi-Yanoshita R, Tanaka K, Shitara N, Chong JM, Iwama T, Miyaki M: p300 gene alterations in colorectal and gastric aggressive phenotype of HCC. Furthermore, its prog- carcinomas. Oncogene 1996, 12:1565-1569. nostic significance can be augmented by the elevated 9. Gayther SA, Batley SJ, Linger L, Bannister A, Thorpe K, Chin SF, Daigo Y, AFP levels and the presence of vascular invasion. Russell P, Wilson A, Sowter HM, et al: Mutations truncating the EP300 acetylase in human cancers. Nat Genet 2000, 24:300-303. Thus, this combined model may be a useful prognostic 10. Fan S, Ma YX, Wang C, Yuan RQ, Meng Q, Wang JA, Erdos M, Goldberg ID, index for HCC. Webb P, Kushner PJ, et al: p300 Modulates the BRCA1 inhibition of estrogen receptor activity. Cancer Res 2002, 62:141-151. 11. Bandyopadhyay D, Okan NA, Bales E, Nascimento L, Cole PA, Medrano EE: Conclusions Down-regulation of p300/CBP histone acetyltransferase activates a Our findings provide a basis for the concept that high senescence checkpoint in human melanocytes. Cancer Res 2002, expression of p300 may play an important role in the 62:6231-6239.
- Li et al. Journal of Translational Medicine 2011, 9:5 Page 11 of 11 http://www.translational-medicine.com/content/9/1/5 12. Fang Z, Fu Y, Liang Y, Li Z, Zhang W, Jin J, Yang Y, Zha X: Increased expression of integrin beta1 subunit enhances p21WAF1/Cip1 doi:10.1186/1479-5876-9-5 transcription through the Sp1 sites and p300-mediated histone Cite this article as: Li et al.: High expression of transcriptional acetylation in human hepatocellular carcinoma cells. J Cell Biochem 2007, coactivator p300 correlates with aggressive features and poor 101:654-664. prognosis of hepatocellular carcinoma. Journal of Translational Medicine 13. Wang J, Liu X, Wu H, Ni P, Gu Z, Qiao Y, Chen N, Sun F, Fan Q: CREB up- 2011 9:5. regulates long non-coding RNA, HULC expression through interaction with microRNA-372 in liver cancer. Nucleic Acids Res 38:5366-5383. 14. Debes JD, Sebo TJ, Lohse CM, Murphy LM, Haugen DA, Tindall DJ: p300 in prostate cancer proliferation and progression. Cancer Res 2003, 63:7638-7640. 15. Isharwal S, Miller MC, Marlow C, Makarov DV, Partin AW, Veltri RW: p300 (histone acetyltransferase) biomarker predicts prostate cancer biochemical recurrence and correlates with changes in epithelia nuclear size and shape. Prostate 2008, 68:1097-1104. 16. Gao Q, Qiu SJ, Fan J, Zhou J, Wang XY, Xiao YS, Xu Y, Li YW, Tang ZY: Intratumoral balance of regulatory and cytotoxic T cells is associated with prognosis of hepatocellular carcinoma after resection. J Clin Oncol 2007, 25:2586-2593. 17. Sobin LH, Fleming ID: TNM Classification of Malignant Tumors, fifth edition (1997). Union Internationale Contre le Cancer and the American Joint Committee on Cancer. Cancer 1997, 80:1803-1804. 18. Han L, Lu J, Pan L, Wang X, Shao Y, Han S, Huang B: Histone acetyltransferase p300 regulates the transcription of human erythroid- specific 5-aminolevulinate synthase gene. Biochem Biophys Res Commun 2006, 348:799-806. 19. Cai MY, Zhang B, He WP, Yang GF, Rao HL, Rao ZY, Wu QL, Guan XY, Kung HF, Zeng YX, Xie D: Decreased expression of PinX1 protein is correlated with tumor development and is a new independent poor prognostic factor in ovarian carcinoma. Cancer Sci 101:1543-1549. 20. Zlobec I, Steele R, Terracciano L, Jass JR, Lugli A: Selecting immunohistochemical cut-off scores for novel biomarkers of progression and survival in colorectal cancer. J Clin Pathol 2007, 60:1112-1116. 21. Ishihama K, Yamakawa M, Semba S, Takeda H, Kawata S, Kimura S, Kimura W: Expression of HDAC1 and CBP/p300 in human colorectal carcinomas. J Clin Pathol 2007, 60:1205-1210. 22. Karamouzis MV, Konstantinopoulos PA, Papavassiliou AG: Roles of CREB- binding protein (CBP)/p300 in respiratory epithelium tumorigenesis. Cell Res 2007, 17:324-332. 23. Borrow J, Stanton VP Jr, Andresen JM, Becher R, Behm FG, Chaganti RS, Civin CI, Disteche C, Dube I, Frischauf AM, et al: The translocation t(8;16) (p11;p13) of acute myeloid leukaemia fuses a putative acetyltransferase to the CREB-binding protein. Nat Genet 1996, 14:33-41. 24. Kurebayashi J, Otsuki T, Kunisue H, Tanaka K, Yamamoto S, Sonoo H: Expression levels of estrogen receptor-alpha, estrogen receptor-beta, coactivators, and corepressors in breast cancer. Clin Cancer Res 2000, 6:512-518. 25. Zhang C, Guo X, Jiang G, Zhang L, Yang Y, Shen F, Wu M, Wei L: CpG island methylator phenotype association with upregulated telomerase activity in hepatocellular carcinoma. Int J Cancer 2008, 123:998-1004. 26. Fermento ME, Gandini NA, Lang CA, Perez JE, Maturi HV, Curino AC, Facchinetti MM: Intracellular distribution of p300 and its differential recruitment to aggresomes in breast cancer. Exp Mol Pathol 88:256-264. 27. De-Carvalho MC, Chimelli LM, Quirico-Santos T: Modulation of fibronectin expression in the central nervous system of Lewis rats with experimental autoimmune encephalomyelitis. Braz J Med Biol Res 1999, 32:583-592. 28. Hudelist G, Czerwenka K, Kubista E, Marton E, Pischinger K, Singer CF: Submit your next manuscript to BioMed Central Expression of sex steroid receptors and their co-factors in normal and malignant breast tissue: AIB1 is a carcinoma-specific co-activator. Breast and take full advantage of: Cancer Res Treat 2003, 78:193-204. 29. Farinati F, Rinaldi M, Gianni S, Naccarato R: How should patients with • Convenient online submission hepatocellular carcinoma be staged? Validation of a new prognostic system. Cancer 2000, 89:2266-2273. • Thorough peer review 30. Lau WY, Lai EC: Hepatocellular carcinoma: current management and • No space constraints or color figure charges recent advances. Hepatobiliary Pancreat Dis Int 2008, 7:237-257. • Immediate publication on acceptance 31. Bruix J, Sherman M: Management of hepatocellular carcinoma. Hepatology 2005, 42:1208-1236. • Inclusion in PubMed, CAS, Scopus and Google Scholar • Research which is freely available for redistribution Submit your manuscript at www.biomedcentral.com/submit
CÓ THỂ BẠN MUỐN DOWNLOAD

-

báo cáo hóa học:" High dose concentration administration of ascorbic acid inhibits tumor growth in BALB/C mice implanted with sarcoma 180 cancer cells via the restriction of angiogenesis"
 9 p |
9 p |  80
|
80
|  7
7
-

báo cáo hóa học:" Anti-angiogenic effect of high doses of ascorbic acid"
10 p | 67
| 6
-
Báo cáo hóa học: " High P–T Nano-Mechanics of Polycrystalline Nickel Yusheng Zhao Æ T. D. Shen Æ Jianzhong Zhang"
16 p | 42
| 6
-

báo cáo hóa học:" Highly selective fluorescent chemosensor for Zn2+ derived from inorganic-organic hybrid magnetic core/shell Fe3O4@SiO2 nanoparticles"
24 p | 55
| 6
-
Báo cáo hóa học: "High Capacity Downlink Transmission with MIMO Interference Subspace Rejection in Multicellular CDMA Networks"
20 p | 42
| 6
-

Báo cáo hóa học: " High-Speed Turbo-TCM-Coded Orthogonal Frequency-Division Multiplexing Ultra-Wideband Systems"
12 p | 42
| 5
-

Báo cáo hóa học: "High activity of sequential low dose chemo-modulating Temozolomide in combination with Fotemustine in metastatic melanoma. A feasibility study"
8 p | 85
| 5
-

báo cáo hóa học:" High correlation of the proteome patterns in bone marrow and peripheral blood blast cells in patients with acute myeloid leukemia"
8 p | 63
| 5
-
Báo cáo hóa học: " High-yield Synthesis of Multiwalled Carbon Nanotube by Mechanothermal Method"
7 p | 46
| 5
-

báo cáo hóa học:" Highly efficient transduction of human plasmacytoid dendritic cells without phenotypic and functional maturation"
12 p | 52
| 5
-

Báo cáo hóa học: " Research Article New Structured Illumination Technique for the Inspection of High-Reflective Surfaces: Application for the Detection of Structural Defects"
14 p | 70
| 4
-

Báo cáo hóa học: " Highly stable meso-diaminopimelate dehydrogenase from an Ureibacillus thermosphaericus strain A1 isolated from a Japanese compost: purification, characterization and sequencing"
37 p | 49
| 4
-

Báo cáo hóa học: " Research Article High-Speed Smart Camera with High Resolution"
16 p | 33
| 4
-
Báo cáo hóa học: "High Efficiency EBCOT with Parallel Coding Architecture for JPEG2000"
14 p | 44
| 4
-

Báo cáo hóa học: " High-Performance Wireless via the Merger of CI Chip-Shaped DS-CDMA and Oscillating-Beam Smart Antenna Arrays"
8 p | 49
| 4
-

Báo cáo hóa học: " Research Article A High-End Real-Time Digital Film Processing Reconfigurable Platform"
15 p | 46
| 3
-
Báo cáo hóa học: " High-rate low-temperature dc pulsed magnetron sputtering of photocatalytic TiO2 films: the effect of repetition frequency"
7 p | 43
| 3


Chịu trách nhiệm nội dung:
Nguyễn Công Hà - Giám đốc Công ty TNHH TÀI LIỆU TRỰC TUYẾN VI NA
LIÊN HỆ
Địa chỉ: P402, 54A Nơ Trang Long, Phường 14, Q.Bình Thạnh, TP.HCM
Hotline: 093 303 0098
Email: support@tailieu.vn
Giấy phép Mạng Xã Hội số: 670/GP-BTTTT cấp ngày 30/11/2015 Copyright © 2022-2032 TaiLieu.VN. All rights reserved.

