


Báo cáo hóa học: " Review Article Comparison among Cognitive Radio Architectures for Spectrum Sensing"
lượt xem 6
download
 Download
Vui lòng tải xuống để xem tài liệu đầy đủ
Download
Vui lòng tải xuống để xem tài liệu đầy đủ
Tuyển tập báo cáo các nghiên cứu khoa học quốc tế ngành hóa học dành cho các bạn yêu hóa học tham khảo đề tài: Review Article Comparison among Cognitive Radio Architectures for Spectrum Sensing
Bình luận(0) Đăng nhập để gửi bình luận!
Nội dung Text: Báo cáo hóa học: " Review Article Comparison among Cognitive Radio Architectures for Spectrum Sensing"
- Hindawi Publishing Corporation EURASIP Journal on Wireless Communications and Networking Volume 2011, Article ID 749891, 18 pages doi:10.1155/2011/749891 Review Article Comparison among Cognitive Radio Architectures for Spectrum Sensing Luca Bixio, Marina Ottonello, Mirco Raffetto, and Carlo S. Regazzoni (EURASIP Member) Department of Biophysical and Electronic Engineering, University of Genoa, Via Opera Pia 11a, 16145 Genova, Italy Correspondence should be addressed to Luca Bixio, luca.bixio@dibe.unige.it Received 28 July 2010; Revised 25 November 2010; Accepted 7 February 2011 Academic Editor: Jordi P´ rez-Romero e Copyright © 2011 Luca Bixio et al. This is an open access article distributed under the Creative Commons Attribution License, which permits unrestricted use, distribution, and reproduction in any medium, provided the original work is properly cited. Recently, the growing success of new wireless applications and services has led to overcrowded licensed bands, inducing the governmental regulatory agencies to consider more flexible strategies to improve the utilization of the radio spectrum. To this end, cognitive radio represents a promising technology since it allows to exploit the unused radio resources. In this context, the spectrum sensing task is one of the most challenging issues faced by a cognitive radio. It consists of an analysis of the radio environment to detect unused resources which can be exploited by cognitive radios. In this paper, three different cognitive radio architectures, namely, stand-alone single antenna, cooperative and multiple antennas, are proposed for spectrum sensing purposes. These architectures implement a relatively fast and reliable signal processing algorithm, based on a feature detection technique and support vector machines, for identifying the transmissions in a given environment. Such architectures are compared in terms of detection and classification performances for two transmission standards, IEEE 802.11a and IEEE 802.16e. A set of numerical simulations have been carried out in a challenging scenario, and the advantages and disadvantages of the proposed architectures are discussed. 1. Introduction intelligent wireless communication system that continuously observes the radio spectrum in order to detect opportunities In the last decades, the introduction of new wireless appli- which are then exploited by adaptively and dynamically cations and services is creating issues in the allocation selecting certain operating parameters (e.g., transmitted of the available radio spectrum [1]. In fact the govern- power, carrier frequency, modulation type and order) [1]. mental regulatory agencies apply the command and con- In such a context, it is widely accepted [4, 5] that Orthog- trol approach, which allocates different frequency bands onal Frequency Division Multiplexing (OFDM) represents to different transmission standards, leading to a heavily one of the most appropriate approaches for CR. In fact, the crowed radio spectrum and to a reduction of the unlicensed OFDM technique allows to model the power spectrum of the frequency bands [2]. However, many studies [1–3] have signal, by dynamically activate/deactivate a set of carriers [5]. pointed out that licensed spectrum is highly underutilized This property can be employed to fit the signal transmitted and have encouraged to apply a more flexible and efficient by secondary user to the unused spectral resources. Such a management of such a precious resource to improve its procedure can be digitally implemented by using the Discrete utilization [1]. To this end, unlicensed (secondary) users Fourier Transform (DFT) at the transceiver [4]. Moreover, could be allowed to access licensed spectrum if, at a given the DFT can also be useful to detect the presence of active time and in a given geographical area, licensed (primary) primary users (e.g., in the time-frequency analysis for signal users are not using it [1]. In particular, a proposed solution detection) [4]. It is clear that, in order to efficiently utilize the radio for exploiting unused resources, also known as oppor- tunities, and for providing the required flexibility is the spectrum, a fast and reliable detection of primary users Cognitive Radio (CR) technology [1]. It can be defined as an is an important requirement [6]. Such fundamental task,
- 2 EURASIP Journal on Wireless Communications and Networking Sampling ··· Processing Classification Information exchange Sampling Sampling ··· Processing Processing Sampling Sampling Information Information Processing Processing reduction reduction Information Information Classification Classification reduction reduction (a) (b) (c) Figure 1: Considered architectures for spectrum sensing: (a) stand-alone single antenna, (b) cooperative terminals, (c) multiple antennas. known as spectrum sensing, is performed by CR terminals separated one half wavelength from each other [16–18]. To this end, different architectures can be proposed. As an which process the received signal applying advanced signal processing techniques. example, several single antenna CR terminals can cooperate Despite the fact that spectrum sensing techniques have by exchanging local observations through a control channel and exploiting the spatial diversity inherent to the different been deeply treated in the open literature [7] for both civilian [8] and military applications [9], many open issues positions in the considered environment. In particular, different levels of cooperation can be defined according to persist, especially in a CR scenario. As an example, many commonly employed spread spectrum transmission tech- the amount of data exchanged among single-antenna CR terminals [19] resulting in different performances, required niques, specifically designed to be confused with noise, are not easily identified by energy detectors [7], while matched processing capabilities and overhead. An alternative architec- filters cannot be easily used in a CR context [6], in which ture is based on a multiple antenna terminal, which exploits the spatial diversity due to the different signals perceived by the a priori information about the transmitted signal is usually not available. An alternative approach to spectrum the antennas. In this case, a control channel is not necessary sensing is based on feature detection technique [8, 10], but additional hardware costs are present. which allows to exploit the unique characteristics of the In this paper, a relatively fast and reliable spectrum transmitted signals [11] in the identification of primary sensing algorithm for the detection of similar OFDM-based users. Among the proposed feature detection approaches, primary transmissions has been considered and applied to evaluate the performances of three different architectures. In a recently appreciated one in CR networks is based on cyclostationary feature extraction [7, 11]. Such an approach particular, a single detector able to distinguish among three allows to overcome the limitations of other techniques, while classes of signal is used. It is based on cyclostationary features providing additional information regarding the frequency extraction and exploits the periodicities in the transmitted waveforms which arise from different pilot carrier patterns band under investigation [7], useful to predict the utilization of the licensed resources by the primary users [12], against and the cyclic prefix. The extracted features are then used an increase of the complexity of the detector. Finally, it is as input to a support vector machine (SVM) which allows important to remark that such an approach is well suited to identify and classify the primary users’ signal. It is to detect OFDM-based standards, since it allows to exploit important to remark that the proposed work is focused the presence of periodicities in the transmitted waveform, on the attempt of verifying the added value derived from such as cyclic prefixes or pilot carriers, as will be clarified in the introduction of the cooperation among terminals or of Section 4. the multiple antenna technology to spectrum sensing. To Despite the high number of spectrum sensing techniques this end, the benefits due to the introduction of the spatial which have been proposed in the open literature [6], and mil- diversity are investigated by analyzing the performances of the three different architectures discussed (see Figure 1) itary [7] applications, spectrum sensing remains a complex task, especially in practical environments, where received and more complex configurations will not be explored. In particular, the trade-offs among processing capabilities, the signals are heavily corrupted by channel impairments (e.g., multipath fading) which can lead to an undesirable missed exchanged information on the control channel, and the detection of the primary users [13, 14]. increase of the number of terminals or antennas, with respect However, it is well known that multipath fading can to the performances and the implementation costs, have been be significantly mitigated by using several receiving anten- extensively evaluated. The paper is organized as follows. In Section 2, a survey nas exploiting spatial diversity [15] since each antenna of spectrum sensing techniques and the related challenges experiences an independent fading if it is approximately
- EURASIP Journal on Wireless Communications and Networking 3 and limitations for CR applications will be provided. In is based on matched filters [10]. Such a coherent detection Section 3, the different architectures for spectrum sensing requires relatively short observation time to achieve a given and the related advantages and disadvantages will be performance [6] with respect to the other techniques dis- presented. Section 4 will describe the proposed spectrum cussed in this section. However, it is important to note that, sensing algorithm for the detection of two OFDM-based in CR networks, the transmitted signal and its related char- transmissions, its application to the spectrum sensing acteristics are usually unknown or the available knowledge is architectures, and a qualitative evaluation of the trade-offs not precise. In this case, the performances of the matched will be discussed in Section 5. Finally, numerical results will filter degrade quickly, leading to an undesirable missed be provided in Section 6 to evaluate the performances of detection of primary users [21]. Moreover, this approach is unsuitable for CR networks, where different transmission the proposed architectures in heavy multipath environments and to quantify the benefits due to the introduction of spatial standards can be adopted by primary users [14]. As a matter diversity. of fact, in these cases, a CR terminal would require a dedicated matched filter for each signal that is expected to be present in the considered environment, leading to prohibitive 2. Spectrum Sensing Techniques: implementation costs and complexity [14]. Limitations and Challenges An alternative approach to spectrum sensing is based on feature detection [7, 14, 22, 23]. Such an approach allows Spectrum sensing is one of the most important tasks which to extract some features from the received signals by using a CR terminal has to perform [6] since it allows to obtain advanced signal processing algorithms and it exploits them awareness regarding spectrum usage by reliably detecting the for detection and classification purposes [22, 23]. In the presence of primary users in a monitored area and in a given spectrum sensing context, a feature can be defined as an frequency band [6]. inherent characteristics which is unique for each class of signals [21] to be detected. To perform signal detection, some commonly used features are instantaneous amplitude, 2.1. Signal Processing for Spectrum Sensing. In order to phase, and frequency [8]. Among the different feature provide a fast and reliable spectrum sensing, different detection techniques which have been proposed in the open techniques have been proposed in the last decades [7–9, 20] literature [7, 8, 24], an approach which has gained attention for signal detection [7], automatic modulation classification due to its satisfactory performances [7, 11, 25] is based [8], radio source localization [9], and so forth. on cyclostationary analysis, which allows to extract cyclic One of the most commonly used approach to detect the features [6, 7, 11, 26, 27]. Such an approach exploits the presence of transmissions is based on energy detector [20], built-in periodicity [7] which modulated signals exhibit since also known as radiometer, that performs a measurement of they are usually coupled with spreading codes, cyclic prefixes, the received energy in selected time and frequency ranges sine wave carriers, and so forth, [10]. The modulated [20]. Such measurement is compared with a threshold which signals are said to be cyclostationary since their mean and depends on the noise floor [6]. The presence of a signal autocorrelation functions exhibit periodicities, which can is detected when the received energy is greater than an be used as features. Such periodicities can be detected by established threshold. Energy detector is widely used because evaluating a Spectral Correlation Function (SCF) [11, 25], of its low implementation, computational complexity and, in also known as cyclic spectrum [7], which, furthermore, the general case where no information regarding the signal allows to extract additional information on the received to be detected is available, is known to be the most powerful signal which can be useful to improve the performance test and can be considered as optimal. On the other hand, of the spectrum sensing [12]. One of the main benefits energy detector exhibits several drawbacks [6, 10] which can obtained by using cyclostationary analysis is that it allows limit its implementation in practical CR networks. In fact, an easy discrimination between noise and signals even in the computation of the threshold used for signal detection is low SNR environments [7]. Moreover, such an approach highly susceptible to unknown and varying noise level [7], allows to distinguish among different primary users since resulting in poor performance in low Signal to Noise Ratio unique features can be extracted for the classes of signals of (SNR) environments [7]. Furthermore, it is not possible to distinguish among different primary users since energy interest. In spite of these advantages, cyclic feature detection is computationally more complex than energy detection detectors cannot discriminate among the sources of the and can require a longer observation time than matched received energy [14]. Finally, radiometers do not provide filters [3]. However, the proposed algorithm allows to obtain any additional information regarding the signal transmitted satisfactory detection performances in a relatively short by the primary users [6, 12] (e.g., transmission standard, observation time as will be shown in Section 6 by numerical modulation type, bandwidth, carrier frequency) which can examples. be useful to predict spectrum usage by primary users [12], allowing to avoid harmful interference while increasing the capacity of CR networks [10]. 2.2. Signal Classification for Spectrum Sensing. In common When the perfect knowledge of the transmitted wave- CR networks, the signal received by the secondary terminal form (e.g., bandwidth, modulation type and order, carrier is usually processed by applying one of the algorithms frequency, pulse shape) [6, 14] is available, the optimum presented in the previous section, in order to perform approach to signal detection in stationary Gaussian noise signal detection [14, 28]. It allows to identify opportunities
- 4 EURASIP Journal on Wireless Communications and Networking (i.e., primary unused resources) which have to be exploited have to be addressed in order to provide satisfactory per- by secondary user without causing harmful interference to formances. primary users [12]. Moreover, in this paper, it is assumed Finally, some works pointed out that SVMs require a long training time, that is, the time needed to design an efficient that a signal classification of the detected primary signal into a given transmission standard is performed. It can be classifier adjusting parameters and structure [34]. However, useful to improve the radio awareness [1, 12, 29] allowing to SVMs can be still applied to spectrum sensing since the design of the classifier can be done off-line exploiting some a predict some spectrum occupancy patterns of the primary user, which indeed may be used to efficiently exploit the priori measurements which can be used as training data. opportunity and, consequently, to increase the utilization of the resource and the throughput of the CR network [12]. 2.3. Spectrum Sensing Limitations. Although advanced signal Signal Classification is usually done by applying well-known processing and pattern recognition techniques can ease the pattern recognition methods to a processed sampled version task of spectrum sensing, several limitations and challenges of the incoming signals [30]. remain, especially when real environments are considered In general, the design of a classifier concerns different [6, 14]. In fact, CR terminals have to detect any primary aspects such as data acquisition and preprocessing, data user’s activity within a wide region corresponding to the representation, and decision making [30]. In CR applica- coverage area of the primary network and the coverage tions, data acquisition is represented by analog-to-digital area of the CR networks [14]. For this reason, a CR conversion (ADC) of the electromagnetic signal perceived by terminal needs a high detection sensitivity [14] which is the antenna, while the preprocessing is represented by the a challenging requirement for wireless communications, signal processing techniques presented in Section 2.1. The especially when spread spectrum transmission techniques are data representation could be provided by some extracted used by primary users. features which can be then used for decision making which Furthermore, spectrum sensing is more complex in those usually consists in assigning an input data (also known as frequency bands where primary users can adopt different pattern) to one of finite number of classes [31]. transmission standards, for example, Industrial, Scientific, Among the approaches which can be used for classi- and Medical (ISM) band. In this case, a CR terminal has to fication, Neural Networks (NNs) and SVMs have recently be able to identify the presence of primary users detecting gained attention for spectrum sensing purposes [32, 33]. different kinds of signals, each one characterized by its One of the most important advantages is that these tools features, by using a single detector to limit hardware costs. can be easily applied to different classification problems and Finally, it is important to remark that in wireless com- usually do not require deep domain-specific knowledge to be munications the received signal is corrupted by multipath successfully used [30]. fading, shadowing, time varying effects, noise, and so forth. Recently, there has been an explosive growth of researches These phenomena can cause significant variations of the about NNs resulting in a wide variety of approaches [34]. received signal strength and, thereby, it could be difficult Among them, the most appreciated one is feedforward NNs to perform reliable spectrum sensing [13, 14]. This is of with supervised learning [34] which are widely used for particular importance in CR networks, where a false detected solving classification tasks [34]. Although it has been shown opportunity, for example, due to a sudden deep fade, can that NNs are robust in the classification of noisy data, they lead to an incorrect spectrum utilization, causing harmful suffer in providing general models which could result in an interference to primary users [13, 14]. overfitting of the data [34]. As a final remark, in order to efficiently utilize the SVMs represent a novel approach to classification orig- available radio resources, the duration and periodicity of inated from the statistical learning theory developed by the spectrum sensing phase have to be minimized. In Vapnik [35], their success is due to the benefits with respect fact, the opportunities have often a limited duration and to other similar techniques, such as an intuitive geometric CR terminals usually cannot exploit them [6, 14], while interpretation and the ability to always find the global performing spectrum sensing. minimum [34]. One of the most important features of an SVM is the possibility to obtain a more general model with respect to classical NNs [35]. This is obtained by 3. Architectures for Spectrum Sensing exploiting the Structural Risk Minimization (SRM) method which has been shown to outperform the Empirical Risk In this section, the main classes of spectrum sensing Minimization (ERM) method applied in traditional NNs architectures will be shown. In particular, stand-alone single [35]. SVMs use a linear separating hyperplane to design antenna, cooperative, and multiple antenna architectures will a classifier with a maximal margin. If the classes cannot be considered (see Figure 1). be linearly separated in the input data space, a nonlinear One of the most simple and widespread architectures transformation is applied to project the input data space in a is based on a stand-alone single antenna terminal. In this higher-dimensional space, allowing to calculate the optimal case the CR terminal, equipped with a single antenna, acts linear hyperplane in the new space. Due to its widespread autonomously to identify the signals transmitted by the applications, nowadays different efficient implementations of primary users on the observed frequency band [10]. The SVM are available in the open literature [36, 37] and only few phases of the spectrum sensing process for this simple archi- decisions regarding some parameters and the architecture tecture are four and can be denoted as sampling, processing,
- EURASIP Journal on Wireless Communications and Networking 5 information reduction, and classification, as shown in Figure the required diversity [16], which can be exploited for 1(a). It is important to remark that, although similar improving radio awareness [2]. architectures have been proposed in literature [22, 23], no As opposed to fast fading, which is a short-time scale information reduction phase is performed. phenomenon, the so-called shadowing or slow fading, a long-time scale propagation phenomenon, can also be Let us analyze in detail each phase. The CR terminal considered. This effect occurs when the transmitted signal exploits the single antenna to collect the signals radiated experiences random variation due to blockage from objects by primary transmitters. The amount of time employed in the signal path, giving rise to random variations of a for the signal collection is the so-called observation time. received power at a given distance [16]. This phenomenon This quantity should be as short as possible [14] in order can cause the undesiderable hidden node problem [6, 13], to maximize the exploitation of the detected opportunity that can be still overcome by means of spatial diversity. [6]. The received signal is sampled and then processed: as shown in Section 2.1, different advanced signal processing However, in this case, the receiving antennas need to be separated by much more than one wavelength since algorithms can be used, according to the available knowledge the shadowing process is frequently correlated over larger of the primary signals to be identified. As an example, feature distances, in the order of some tens of meters or more. detection-based techniques can be used in order to extract the unique characteristics of the different signals which can This means that the multiple antenna architecture would not be able to overcome the hidden node problem since then be used for classification purposes. all received signal versions would be affected by the same To simplify the problem, decreasing the complexity of level of shadowing attenuation. On the contrary, the coop- the following classification phase and shortening the global erative architecture may be able to overcome the hidden elapsing time, the information contained in the highlighted node problem if the cooperating CRs are apart enough to characteristics can be reduced. As an example, classical receive sufficiently uncorrelated versions of the same primary eigenvalue method for linear feature reduction [38], used in signal. pattern recognition, can be applied in order to reduce the As regards the other aspects, firstly let us consider the problem complexity. cooperative architecture where the CR terminals form a Once the processing and the information reduction distributed network sharing the collected information in phases are performed, and the differences among signals are order to improve the performances of the spectrum sensing pointed out, a classification phase is required to discriminate phase [2]. among the signals transmitted by primary users. Different Different strategies of cooperation and network topolo- techniques, presented in Section 2.2, can be used in order gies can be implemented: in this paper, a centralized network to obtain a precise classification phase. As an example SVM is considered. In particular, the proposed architecture is [34, 36, 37] is a well-known classifier which can be used for composed by a set of cooperative single antenna terminals, as different problems and applications. shown in Figure 1(b), which individually sense the channel, Despite the fact that the simplicity of the stand-alone sample and process the received signal, and finally send the single antenna architecture makes it attractive from an collected information to a fusion center, usually represented implementation point of view, it suffers in multipath and by a predefined terminal belonging to the network with shadowing environments [16, 21] where the deep and fast enhanced signal processing capabilities. It aggregates the fades of the received signal strength and the hidden node received local observations [19] for identifying the signals problem can lead to an incorrect spectrum utilization [6, 13], transmitted by primary users. In order to mitigate such drawbacks, a longer observation Among the advantages of such an architecture, it is time can allow to achieve satisfactory performances, but such important to remark that it allows not only a performance a solution is not exploited in practice since fast opportunity improvement, as will be shown in Section 6, but also is well detection is desirable in practical CR networks [6]. suited for IEEE 802.22 WRAN [3], where a base station To overcome the disadvantages of the stand-alone single can act as a fusion center [13]. As regards the costs, it is antenna architecture, cooperative and multiple antenna possible to highlight that, on one hand, the cooperative CR architectures can be proposed [6, 21]. In particular, while terminals can achieve the same performances of a stand- both cooperative and multiple antenna system can be alone CR terminal by using less performing and cheaper employed to mitigate multipath fading, just cooperative hardware [13]. On the other hand, the increase of the approach can be used to limit shadowing effects. number of terminals leads to a consequent rise in costs. Moreover, the information forwarded to the fusion center Multipath (fast) fading, that is, deep and fast fades of the implies the introduction of a dedicated control channel received signal strength, is the most characteristic propaga- (not always available in CR contexts), and a consequent tion phenomenon in multipath environments. However, its degrading effects can be overcome by exploiting the spatial coarse synchronization, to avoid a modification of the diversity due to the different positions of the CR terminals or electromagnetic environment during the spectrum sensing phase. of the several receiving antennas, in cooperative and multiple Since a control channel may not be available in practical antenna systems, respectively. In fact, the antennas separated CR applications, a multiple antenna architecture can be one wavelength or more are expected to obtain uncorrelated considered as an alternative solution for providing the useful signals [17, 18] and thereby each antenna receives a signal spatial diversity. corrupted by an independent multipath channel providing
- 6 EURASIP Journal on Wireless Communications and Networking To fusion center Different level of exchanged information Sampled SCF Extracted SCF Decision signal projection features SCF Projection Features SVM ADC classifier estimator estimator extraction Sampling Processing Information reduction Classification Figure 2: Block diagram for the spectrum sensing algorithms for the considered architectures. In such an architecture, the CR terminal receiving anten- Note that the considered processing algorithms, pro- nas are thought as an antenna array with a digital beamform- posed as full proof in [33], have been exploited in other ing receiving network, as shown in Figure 1(c). This strategy, works [21, 40–42]. However, the performances of these that is similar to a distributed system architecture with an algorithms have not been extensively evaluated yet. In fact, ideal control channel (i.e., no transmission delay and channel in [41] the influence of the dimension of an ensemble distortions), exploits the complexity of the environment, as of neural networks in the classification phase is studied, happens for multiple-input multiple-output systems [16]. while in [40] the analysis is focused on a comparison of different data fusion techniques for cooperative spectrum Multiple antenna architectures do not require a control sensing. Moreover, although in [21, 42] an analysis of the channel and allow to take advantage from the spatial diversity proposed algorithms is presented, only a few results and [16] also for the opportunity exploitation, by managing the discussions related to the performances have been reported radiation pattern so as to mitigate the interference with for a cooperative architecture [42] and for a multiple antenna primary users [39]. However, the previouse advantages are architecture [21]. paid in terms of an increase of the hardware costs due to In this paper, we are interested in comparing the per- the presence of several receiving antennas and to the higher formances of the considered algorithms when applied to the processing capabilities required for real-time aggregation of three architectures of interest. In particular, a deep compar- the signals gathered by each antenna. ative analysis of the performances of the three architectures Note that essentially the same processing chain, shown in will be presented, evaluating the relations among processing Figure 1(a), can be applied to all the considered architectures. capabilities (and hence the information reduction), the However, there are some differences. The most evident one exchanged information on the control channel, and the is the introduction of an information exchange phase, if the increase of the number of terminals or antennas, with respect cooperative architecture is considered. to the performances and the implementation costs. To this Finally, a comprehensive analysis will be provided in the end a comprehensive qualitative and quantitative analysis following, by comparing the performances and implemen- will be provided in the following sections. tation trade-offs pointed out in this section, for the stand- As a final remark, in [21, 33, 40–42], the CR receiver is alone single antenna, the cooperative single antenna, and the supposed to be synchronized in the time domain with the multiple antenna architectures. primary transmitter (i.e., the input of the processing phase is represented by a set of entire number of OFDM symbols) which is an undesirable hypothesis in practical scenarios. 4. Reference Scenario and Proposed Analysis Differently, in this paper, no synchronization assumption is assumed to obtain the experimental results provided in In the present section, the developed algorithms to perform Section 6. For this reason, the proposed algorithm can be a reliable spectrum sensing phase in CR networks are deeply considered semiblind since the only parameters needed to analyzed. They can be grouped in the processing chain shown perform the detection are the bandwidth and the number in Figure 2, composed by four main phases, that is, sampling, of samples in an OFDM symbols. The estimation of this processing, information reduction, and classification. Each parameters is out of scope of the present paper; however, they phase is detailed in the following. can be obtained by applying some algorithms presented in the open literature [43]. In order to provide a fair comparison of the perfor- The performance of the three architectures is evaluated in mances obtained by the three architectures, they implement a challenging scenario, in which one CR terminal (single or the same logical scheme shown in Figure 2 (with a few excep- multiple antenna) or several CR terminals (cooperative) have tions related to the introduction of the information exchange not only to detect the presence of a primary user, but also phase). Moreover, the same signal processing algorithm for to classify the used transmission standard. It is important each phase of the chain is applied and, for the same reason, to remark that, in order to provide an upper bound for the only multipath fading is considered in the simulations.
- EURASIP Journal on Wireless Communications and Networking 7 sampled signal x(n), processed in L blocks of length NSCF , achievable performances, just one primary user is considered while Xl (k) represents the DFT of x(n) of size NSCF : in the frequency band of interest, as usually considered in the literature [2, 5, 11, 12]. NSCF −1 The primary user can transmit IEEE 802.16e [44] or x(n)e− j (2π/NSCF )kn . Xl (k) = (2) IEEE 802.11a [45] signals in the same frequency band. Such n=0 signals are very similar, since both the considered standards The SCF is hence obtained by processing L · NSCF samples use the same transmission technique (i.e., OFDM), and are intentionally designed to occupy the same bandwidth, as will of the received signal. It is of interest to recall that the SCF be explained in Section 4. Moreover, the signal transmitted reduces to the conventional power spectral density function for α = 0 while, in general, it represents a measure of the by the primary user is corrupted by Additive White Gaussian Noise (AWGN) and heavy multipath distortions [46], that correlation between the spectral components of the signal x(n) at the discrete frequencies k and k − α [7]. can lead to an undesirable missed detection. Finally, in order to summarize the analyzed configura- Although the SCF is a powerful tool, it has to be properly tions, let us indicate CAt as a CR architecture in which the designed in order to extract valuable periodicities. As a n subscript n ∈ {1, 3, 5, 7} denotes the number of cognitive matter of fact, if the sampling frequency does not correspond terminals that compose the system, while the superscript t ∈ to an integer multiple β, also known as oversampling factor, {1, 3, 5, 7} denotes the number of antennas that equip each of the one used by the OFDM transmitter, or if the NSCF terminal. By using the introduced notation, let us analyze in parameter is not set equal to the size of the DFT used details the different architectures: by the transmitter, then the SCF does not exhibit periodic behavior and reliable spectrum sensing cannot be obtained (1) CA1 for the stand-alone single antenna architecture, [33]. For the above reasons, an ad hoc SCF estimator has 1 (2) CA1 with n = 3, 5, 7 for the cooperative architecture. to be designed for each class of primary users’ signals to n be classified. Such a necessity can lead to an undesirable In this case, a control channel is introduced and increment of hardware costs, since for each transmission one of the CR terminals belonging to the centralized standard a properly designed SCF estimator is required. network acts as fusion center, One of the features of the considered approach is to (3) CAt with t = 3, 5, 7 for the multiple antenna reduce the required computational effort, by equipping the 1 architecture. Each antenna receives a different signal, CR terminals with a single SCF estimator, based on (1) that is sampled and put besides to the other ones to and designed for classifying the three classes of signal of form a longer signal that is then processed. interest: IEEE 802.16e [44], IEEE 802.11a [45], and no transmission (in this case, only noise is received). Note that, 4.1. Sampling and Processing Phases. Let us analyze in detail although the required computational effort is considerably the spectrum sensing algorithms which equip the three decreased, the proposed single SCF estimator leads to a considered architectures. satisfactory performance, as will be shown in Section 6, At first, during the sampling phase, each antenna senses since just a negligible decrement of the performances is the radio environment and raw data are collected by obtained in classifying IEEE 802.16e signals. Such approach sampling the received signal. exploits the periodicities that arise from the pilot carriers, In the next phase that is, the processing phase, the sam- commonly used in OFDM systems for channel estimation pled signal is analyzed by using a cyclostationary analysis. It and synchronization purposes, in order to distinguish among is important to note that if the multiple antenna architecture the considered classes of signals. As a matter of fact, the is considered, the sampled signal received by each antenna time-frequency patterns of the pilot carriers, intentionally is placed side by side to form a longer signal which is embedded in the waveform transmitted by using both then processed. As pointed out in Section 2, cyclostationary considered transmission standards, are different. This leads analysis allows to extract valuable information regarding to different periodicities, which can be detected if the SCF the correlation of the spectral components of the signals estimator is correctly designed. In order to obtain the under investigation, overcoming the difficulties of low SNR required single SCF estimator, the parameters in (1) are set environments. It is well suited to the proposed architectures so that the periodicities regarding IEEE 802.11a [45] signals since it allows to exploit the periodicities that arise in the can be easily extracted, while distorted but still clear features modulation process of the OFDM signals, such as cyclic for IEEE 802.16e [44] signals can be obtained, as will be prefixes, pilot carriers, or training symbols. In particular, an described in Section 4.2. evaluation of the SCF is provided by using the following As can be easily noted in Figure 3, the SCF for an IEEE discrete time estimator [11]: 802.11a [45] signal exhibits a periodic behavior due to the correlation among the pilot carriers, which can be used as L 1 features in order to detect primary user’s transmission. It is Xl (k)Xl∗ (k − α)W (k), Sα (k) = (1) x L l=1 important to remark that Figure 3 is obtained by processing a signal of L = 500 blocks and with an energy per bit to noise power spectral density ratio of Eb /N0 = 0 dB. Hence, clear where W (k) is a spectral smoothing window [11]. α is the discrete cyclic frequency which represents the distance, in the features can be pointed out by using the SCF estimator even frequency domain, among the spectral components of the in low SNR environment and with short observation times.
- 8 EURASIP Journal on Wireless Communications and Networking P (α) (a.u.) |Sx α (k )| 120 110 100 90 0 10 20 80 70 30 40 50 k 60 60 70 50 10 20 30 40 50 60 70 80 α 80 40 α Figure 3: SCF estimation for an IEEE 802.11a signal with L = 500 IEEE 802.11a and Eb /N0 = 0 dB. IEEE 802.16e Noise Figure 4: Projection P (α) for an IEEE 802.11a signal, an IEEE 4.2. Information Reduction Phase. In order to reduce the 802.16e signal, and no transmission (noise) with L = 500 and amount of data to be processed during the classification Eb /N0 = 0 dB. phase, that can heavily affect the elapsing time, the infor- mation reduction is performed after the SCF processing, as shown in Figure 2. where d is the distance in carrier spacing among the equally In the proposed approach, the first information reduc- spaced pilot carrier, NFFT is the DFT size at the IEEE 802.11a tion step allows to compress the whole amount of data [45] transceiver, and J is the number of pilot subcarrier. The of the three-dimensional SCF by evaluating its normalized set Γ2 allows to discriminate among noise and OFDM-based projection: transmissions, exploiting the second-order cyclostationarity maxk Sα (k) arising from the presence of the cyclic prefix [16] in both NSCF x P (α) = α = 1, . . . , . , (3) IEEE 802.11a [45] and IEEE 802.16e [44] transmission maxk S0 (k) β x standards [11]. Such a cyclostationarity leads to a higher value of the SCF of the OFDM-based transmissions for the Figure (4) shows the projections P (α) for an IEEE 802.11a signal, an IEEE 802.16e signal, and noise with L = 500 and first cyclic frequencies [11] with respect to the one of the Eb /N0 = 0 dB. One can deduce that, although the amount noise (see Figure 4). In this work, the most significant cyclic frequency (i.e., the one which leads to the highest value in the of data has been significantly reduced, the periodicity is SCF) has been considered still clearly visible and it is represented by the peaks in the projection. NSCF 1 The second reduction step for further compressing the {α ∈ Γ2 } = . (6) β NFFT information can be performed by extracting two features from the projection for each class of signals of interest. In In this work, NSCF = 160, β = 2, NFFT = 64, J = 4, and particular, this is done by using d = 14 have been chosen. By applying these values in (5) and in (6), one can obtain the sets Γ1 and Γ1 as follows: P (α) α∈Γi FΓi = i = 1, 2, , (4) α∈Γi P (α) / Γ1 = {17, 35, 52}, (7) where Γi is a set of values of α which points out the periodic Γ2 = {1}. behavior (i.e., the unique characteristic) of the considered signals. An example of the features extracted by using (4) is To this end, the set Γ1 allows to discriminate between shown in Figure 5. In particular, it represents the features IEEE 802.11a [45] and IEEE 802.16e [44] signals exploiting for the three classes of signal of interest for Eb /N0 = 0 dB the second-order cyclostationarity arising from the pilot and L = 500 processed blocks (i.e., an observation time of carrier insertion. In particular, IEEE 802.11a [45] pilot 2 (ms)). Note that, although the received power and the carriers are equally spaced in the frequency domain of an observation time are relatively low, the features representing integer number of carrier spacing (i.e., the inverse of the each class are fairly clustered and can be easily identified. OFDM symbol duration [16]) leading to a peak in the SCF Such a property is exploited in the following phase for at a given cyclic frequency (see Figure 4) given by classifying the primary signal. It is important to remark that the information reduction NSCF j α j ∈ Γ1 = step allows the three proposed architectures to shorten j = 1, . . . , J − 1, d, (5) β NFFT the classification time, and hence the entire computation
- EURASIP Journal on Wireless Communications and Networking 9 time. This is of fundamental importance in CR application since any opportunity detection and exploitation have to be performed in real time. Furthermore, it allows to reduce the amount of information exchanged on the control channel, when the cooperative architecture is used. In particular, different amount of data can be sent by the FΓ2 CR terminals to the fusion center or can be used as input to the classification phase of the stand-alone single antenna and multiple antenna architectures. Let us analyze in detail such aspect by considering the different amount of information which can be managed in the presented spectrum sensing chain, that is, 0 1 2 3 4 5 6 7 FΓ1 (i) the sampled signal. In this case, the signal perceived by the antenna is sampled and directly sent to the fusion IEEE 802.11a center: the CR terminal merely acts as data collectors. IEEE 802.16e Noise The signal length depends on the sampling frequency and on the observation time. As an example, for a Figure 5: Plane of the features for an IEEE 802.11a signal, an IEEE signal observed for 2 ms and sampled at a frequency 802.16e signal and no transmission (noise) with L = 500 and of 40 MHz, the signal length is equal to 80000 Eb /N0 = 0 dB. samples. Such a configuration requires high channel and computational capabilities, respectively, to send and to process the entire collected signals at the features are used as input to the classification phase even fusion center, a tough problem in real environments, for the stand-alone single antenna and the multiple antenna architectures. (ii) the SCF. In this case, the received signal is sent to the fusion center after the sampling and the SCF process- 4.3. Classification Phase. During the classification phase, ing by using (1). The length of the three-dimensional which represents the last step of the spectrum sensing chain SCF is equal to (NSCF /β)2 samples. Usually NSCF is (see Figure 2), the collected and processed information has to a high number (e.g., 128, 256), and even in this be exploited in order to detect the presence of primary users case, the amount of exchanged information can be and to classify their related transmission standards. unsuitable in a practical CR scenario, To this end, a multiclass SVM classifier is designed. (iii) the SCF profile. A more efficient and practical As highlighted in Section 2.2, it is a widespread approach information exchange can be obtained by adding applied to both regression and classification problems the information reduction phase to the previous because of its satisfying performances. The basic aspects considered steps by using (3). In such a way, a necessary for understanding the classification step are intro- significant compression of the information sent on duced in the following. the control channel is obtained: the length of the SCF In general, the classification involves two phases known profile is only NSCF /β − 1 samples, as training and testing [37]. During the training phase, some data instances composed by extracted features and (iv) the extracted feature. A further improvement in the efficiency of the information exchange phase can be class labels are used to design a classifier adjusting its parameters and structure [37]. The obtained classifier is then obtained by applying the second information reduc- used during the testing phase to associate a data instance tion step by using (4). In this case, only two features composed by extracted features to a class label [37]. (a few bits) are transmitted to the data fusion center, In the considered scenario, a multiclass SVM classifier is obtaining a framework exploitable in a real scenario, needed since three possible classes are available. The “one- (v) only decision. In such case, the CR terminals perform against-one” approach [36] is used to design the multiclass all the steps of the processing chain, from the SVM composed by three binary classifier constructed by sampling to the classification phase, and they training data from the ith and the j th classes by solving the transmit to the fusion center only the classification following two-class classification [36, 37]: results. Although such an approach allows to further compress the information to be sent, it requires to 1 ij T ij wi j + C ξt min w implement a classifier at each terminal. 2 wi j ,bi j ,ξ i j t T ij Since we consider a CR application where information ij ij φ(xt ) + b ≥ 1 − ξt , xt ∈ ith class subject to w exchange among cooperative CR terminals has to be limited, T ij in the present contribution the extracted features, by using wi j φ(xt ) + bi j ≤ −1 + ξt , xt ∈ j th class (4), are sent to the fusion center which exploits them for ij ≥ 0, ξt C > 0, classification purposes. Moreover, in order to provide a fair comparison among the three architectures, the extracted (8)
- 10 EURASIP Journal on Wireless Communications and Networking where xt is the training set composed by a subset of the As a general remark, during the design of a cooperative or a multiantenna system, it is important to sufficiently extracted features by using (4), w is the vector normal to the hyperplane, b is a bias term, ξ is a slack variable, φ(·) separate the antennas (of one or more terminals) in order to is a mapping function, and C is the penalty parameter take advantage of the spatial diversity, receiving uncorrelated signals. As recalled in Section 3, one wavelength is sufficient of the error term. From a geometric point of view, the for mitigating multipath fading effects while tens of meters training vector xt is nonlinearly mapped into a higher- dimensional space by using the mapping function φ(·). In are required to avoid shadowing. In this sense, a low number of uncorrelated users would be more effective in overcoming this higher-dimensional space, the SVM finds the optimal linear separating hyperplane [36, 37]. It is important to note the hidden node problem than a large number of correlated pT pq q users, as it has been shown in many cooperative spectrum that K (xt , xt ) ≡ φ(xt ) φ(xt ) is known as kernel function sensing studies. Since, in order to provide a fair comparison, and it plays a key role in the nonlinear transformation. the quantitative evaluation provided in the next section Among the different kernel functions which can be used, in takes into account only the first effect, in the following this work, a radial basis function (RBF) is applied: the uncorrelation of the signals at the antennas has been q2 p p q K xt , xt = e−γ xt −xt always assumed. Let us provide a qualitative evaluation of the γ > 0. , (9) influence of the other parameters pointed out in the previous This function allows to manage nonlinear problems and it list, on cooperative and multiple antenna architectures, with has already been successfully used in similar classification respect to the stand-alone single antenna terminal. problems [47]. Moreover, it is less complex with respect to In the cooperative architecture, an increase of the other functions while guaranteeing satisfying performances number of terminals allows an obvious improvement in the [36, 37]. To obtain the best multiclass SVM, the involved performances, but a consequent rise in cost. As regards the parameters γ (see (9)) and C (see (8)) are optimized by processing capabilities necessary to perform the spectrum using a cross-validation via parallel grid-search algorithm, sensing phase, it can be useful to point out that Ptot that is, the as proposed in [36], which guarantees the best possible total amount of processing capabilities of each architecture performances in terms of correct detection and classification can be separated in Pfusion (the processing capabilities of the of the transmitted signals. Finally, the slack variable ξ is set data fusion center) and Pterminal (the processing capabilities to the default value 0.001 which is suitable for most of the of the other cooperative CR terminals). Hence, it is possible common cases and it allows to find the bias term b which to write satisfies (8) given C , γ, and ξ [36, 37]. Ptot = Pfusion + (n − 1) · Pterminal , n > 0. (10) 5. An Analysis of the Performance Trade-Offs for the Three Architectures Formula (10) can represent not only the cooperative archi- tecture, but also the other ones since for CAt it reduces to 1 For the three proposed systems, different considerations Ptot = Pfusion . In fact, in such case, the signal processing regarding the architectural limitations and the parameters algorithm is implemented in the only terminal available. which have to be taken into account to design efficient termi- From (10), one can easily see that in the cooperative nals can be pointed out. In particular, such parameters are architecture, for a fixed Ptot , it is possible to reduce Pfusion with an increase of Pterminal , or vice versa: that is, the (i) performances, tasks of the data fusion center can be simplified if the (ii) costs, processing capabilities of the terminals increase, or vice versa, (iii) number of antennas, As an example, if each terminal performs sampling, SCF (iv) number of terminals, processing, information reduction, and classification, then the fusion center’s tasks are reduced to simply collect the (v) processing capabilities, decision of the CR terminals. On the contrary, if the CR (vi) information reduction, terminals perform only the sampling of the signals, all the (vii) information exchange, other functions are delegated to the data fusion center: (viii) spatial displacement. in such a case the cooperative architecture is similar to a multiple antenna one, since the CR terminals act as simple The evaluation problem can be simplified by splitting the sensors, while the “intelligence” of the system resides in the variables of interest for the cooperative and multiantenna data fusion center. architectures as follows: In this way, the distribution of the processing capabilities (i) for CA1 the reduction of the information and affects the costs: in fact, terminals will be more or less n hence its exchange through the control channel, the expensive in accordance with the hardware equipment distribution of the processing capabilities between needed to perform the processing. the data fusion center and the other terminals, and Moreover, the distribution of the processing capabilities the number of terminals have to be considered in the is strictly tied to the amount information that needs to be analysis of the performances and costs; exchanged through the control channel. By considering the (ii) for CAt the performances and the costs will be previous example, in fact, it is possible to notice that, if 1 analyzed by varying the number of the antennas. the CR terminals perform only the sampling of the received
- EURASIP Journal on Wireless Communications and Networking 11 signals, with a consequent decrease of the hardware costs, a Table 1: COST 207—Bad Urban channel model [46] parameters. high channel capacity is required in order to send the entire Propagation delay Path power Delay spread signals to the fusion center. The amount of the exchanged Path number (μs) (μs) (dB) information is evidently affected by n: an increase of the −3 0 0.0 number of cooperative terminals directly corresponds to an increase of the information exchanged on the control 1 0.4 0 channel. −3 2 1.0 2.4 As far as the multiple antenna architecture is concerned, −5 3 1.6 the costs will increase by increasing t : this fact is not only −2 4 due to the obvious rise in costs of the antennas, but also to a 5.0 required increase of the processing capabilities. In particular, −4 5 6.6 in order to obtain the same whole elapsing time of a stand- alone single antenna architecture, the multiple antenna ter- minal has to be equipped with higher hardware capabilities evaluated for practical applications, the received signals are affected by AWGN and heavy multipath distortions by using (hence more expensive). In fact, the SCF evaluation (see Figure 2) for the multiple antenna system has to be done the COST 207—Bad Urban channel model [46] whose main on the signal obtained by joining the signal received by all characteristics are reported in Table 1 [46]. Furthermore, a antennas, which is t times longer than the one employed by Doppler frequency of fd = 100 Hz has been considered to the single antenna system, if the same observation time is simulate moving users in the domain of interest. considered. As it has been already pointed out in Section 4, a single SCF estimator has been designed to reduce hardware cost and the computational complexity. In particular, the considered 6. Numerical Results and Simulations processing chain is designed to easily detect IEEE 802.11a signals [45] by evaluating clear features, while IEEE 802.16e In order to evaluate the effectiveness of the proposed signals [44] are detected by exploiting distorted features. In fact, two important parameters which affect the effectiveness architectures, a set of simulations have been carried out. The tests have been divided into three subsections, describing of the proposed processing chain are the sampling frequency the general spectrum sensing performances, the influence of fs and the dimension of the SCF estimator NSCF , as shown in the information reduction phase on the performances, and Section 4.1. During the performed simulations all signals are some consideration regarding the elapsed time for processing treated by using their equivalent baseband representations. and classification phases. In particular, in the considered We consider an fs = 40 MHz, which corresponds to an reference scenario, the primary users can communicate by oversampling factor of β = 2. Since the proposed SCF using IEEE 802.11a [45] and IEEE 802.16e [44] transmission estimator is tailored for IEEE 802.11a [45] signal detection, standards. The proposed stand-alone single antenna, coop- NSCF is set to 160 in order to accommodate an entire IEEE erative single antenna and multiple antenna architectures 802.11a [45] OFDM symbol. It is important to note that have to detect the presence of primary users in the radio the proposed algorithm can be considered semi-blind since environment and to identify the related transmission stan- the only parameters needed to perform the detection are dard in order to exploit the available resources. It is assumed the bandwidth and the number of samples in an OFDM that the antennas are sufficiently separated to each other to symbols. The estimation of this parameters is out of scope receive uncorrelated signals (i.e., the antenna separation is of the present paper; however, they can be obtained by one half wavelength or more [16–18]) for both cooperative applying some algorithms presented in the open literature single antenna and multiple antenna architectures. In order [43]. In order to provide a comprehensive analysis, a to provide a fair comparison, shadowing effects have not wide set of simulations have been carried out to evaluate been considered in the analysis. Moreover, because of the the performances of the proposed spectrum sensing phase implemented by the considered architectures, under different short observation times considered during the spectrum sensing phase, long-time scale propagation phenomenon constraints. In particular, 500 sets of features have been can be considered constant. Under the hypothesis of the generated by using sufficient separation of the antennas, spatial diversity can be Υ = FΓi , n i = 1, 2, n = 1, 3, 5, 7 exploited and, as expected [3, 6, 10, 13, 14], an increment (11) of the performances has been verified. It is important to for different values of the observation time Tobs ∈ {2, 3, 5, 10} recall that spectrum sensing in the proposed scenario is challenging, since both considered transmission standards (ms), energy per bit to noise power spectral density ratio Eb /N0 ∈ {−5, 0, 5, 10, 15} (dB), class of signal S ∈ adopt the OFDM technique. Moreover, the bandwidth of {IEEE802.16e, IEEE802.11a, noise}, and number of cooper- the IEEE 802.16e [44] transmitted signal is chosen to be ative CR terminals n ∈ {1, 3, 5, 7} or number of receiving equal to 20 MHz, which corresponds to the one of the IEEE antenna t ∈ {1, 3, 5, 7}. Therefore, Ωtot = 30000 sets 802.11a [45] transmitted signal. The modulation used on of features Υ have been generated for each number n of each subcarrier is Quadrature Phase Shift Keying (QPSK) cooperative CR terminals or for each number t of receiving for both transmission standards. Since, in this work, the antenna. It is important to note that the dimension of the performances of the proposed architectures have to be
- 12 EURASIP Journal on Wireless Communications and Networking 1 1 0.995 0.98 0.99 0.985 0.96 0.98 Pcorr Pcorr 0.94 0.975 0.97 0.92 0.965 0.96 0.9 0.955 0.88 0.95 −5 0 5 10 15 0.002 0.003 0.004 0.005 0.006 0.007 0.008 0.009 0.01 Eb /N0 (dB) Tobs (s) n = 1, t = 1 n = 3, t = 1 n = 1, t = 1 n = 3, t = 1 n = 1, t = 3 n = 5, t = 1 n = 1, t = 3 n = 5, t = 1 n = 1, t = 5 n = 7, t = 1 n = 1, t = 5 n = 7, t = 1 n = 1, t = 7 n = 1, t = 7 Figure 6: Probability of correct detection Pcorr versus energy per bit Figure 7: Probability of correct detection Pcorr versus observation to noise power spectral density ratio Eb /N0 for different numbers n time Tobs for different numbers n of cooperative single antenna CR of cooperative single antenna CR terminals and multiple antenna terminals and multiple antenna CR terminal with a variable number CR terminal with a variable number t of antennas. t of antennas. set of features Υ depends on the number of CR terminals in that all the considered values of the observation time Tobs are used to draw Figure 6. Figure 7 shows the probability the architectures. In particular, if the cooperative architecture is considered, then the dimension of Υ is equal to i × n, of correct detection versus the considered values of Tobs . Even in this case all the considered values of Eb /N0 are where i represents the number of extracted features (equal to used to draw Figure 7. As it can be easily deduced, the 2 in the proposed algorithm), while if the multiple antenna architecture is considered, then the dimension of Υ is equal performances increase as the observation time and the SNR increase, as expected. In fact, Pcorr approaches to one if to i. This is due to the fact that, if a cooperative architecture high values of Eb /N0 and Tobs are considered. Moreover, the is considered, the set of features sent by each terminal to the performances increase with the number n of the cooperative fusion center are collected by using (11). On the other hand, single antenna CR terminals and the number t of antennas in if a multiple antenna architecture is considered, the signals the multiple antenna architecture at the cost of an increment perceived by each antenna are placed side by side resulting in in computational complexity due to either overhead for a longer aggregated signal to be processed. The dimension of Υ is important since it affects the elapsed time of the dedicated control channel allocation and hardware cost for several receiving antennas, respectively (see Section 4.1). classification phase as will be clarified in the following by It is important to remark that the performances of the showing numerical examples (see Table 5(a)). cooperative architecture outperform the multiple antenna A single multiclass SVM classifier has been generated, as architecture. This is due to the fact that, in this paper, the described in Section 4.3, for each number of cooperative CR signals perceived by all antennas of the multiple antenna terminals or for each number of receiving antenna by using architecture are joined together with no additional elabo- Ωtrain = 15000 sets of features for the training phase. The ration, as described in Section 4. Thus, the performances set Ωtrain is composed by an equal number of sets of features reported in the figures can be considered as a lower bound for each EB /N0 , Tobs and class of signals, in order to obtain for such an architecture. By applying advanced signal pro- a general classifier. Finally, Ωtest = Ωtot − Ωtrain = 15000 cessing algorithms, specifically designed to combine signal sets of features are used for testing the obtained classifiers in exploiting diversity [16], a further improvement of the order to evaluate the performances of the proposed spectrum performances can be obtained. Note that, the performance sensing algorithms for the considered architectures. reported in the figures for the cooperative architecture can be considered as an upper bound for the performances of 6.1. Spectrum Sensing Performances. As a first example of such an architecture. In fact, an ideal control channel is the obtained results, in Figure 6 the probability of correct supposed. In practice, in real environment, the exchanged detection Pcorr , that is the probability to correctly detect and information is corrupted by channel impairments which can negatively affect the performances. However, if the amount classify the transmission standard used by the primary user, is reported for different values of the simulated Eb /N0 . Note of data to be shared is limited, as in this case where only two
- EURASIP Journal on Wireless Communications and Networking 13 Table 2: Confusion matrices for Tobs = 2 ms. Table 3: Confusion matrices for Eb /N0 = −5 dB. (a) n = 1, t = 1 (a) n = 1, t = 1 Noise IEEE 802.16e IEEE 802.11a Noise IEEE 802.16e IEEE 802.11a Noise 98.9% 1.1% 0% Noise 99.2% 0.8% 0% IEEE 802.16e 9.0% 90.2% 0.8% IEEE 802.16e 28.1% 71.7% 0.2% IEEE 802.11a 1.4% 1.9% 96.7% IEEE 802.11a 2.8% 3.6% 93.6% (b) n = 1, t = 3 (b) n = 1, t = 3 Noise IEEE 802.16e IEEE 802.11a Noise IEEE 802.16e IEEE 802.11a Noise 99.3% 0.7% 0% Noise 98.9% 1.1% 0% IEEE 802.16e 5.5% 94.4% 0.1% IEEE 802.16e 13.3% 86.7% 0% IEEE 802.11a 0.1% 1.8% 98.1% IEEE 802.11a 0.2% 3.3% 96.5% (c) n = 3, t = 1 (c) n = 3, t = 1 Noise IEEE 802.16e IEEE 802.11a Noise IEEE 802.16e IEEE Noise 99.6% 0.4% 0% Noise 99.7% 0.3% 0% IEEE 802.16e 1.7% 98.3% 0% IEEE 802.16e 4.1% 95.8% 0.1% IEEE 802.11a 0% 0.1% 99.9% IEEE 802.11a 0% 0.1% 99.9% extracted features (i.e., two real values) have to be exchanged, classification problem where each value represents the per- Adaptive modulation and Coding (AMC) techniques [16] centage for which the actual signal present (i.e., the rows) can be used to mitigate this issue. In fact, these tech- is detected and classified as one of the three possible classes niques enable robust and spectrally-efficient transmission of signal (i.e., the columns). The proposed cooperative and over time-varying channels [16]. In particular, by adding multiple antenna architectures show a higher sensitivity systematically generated redundant data to the exchanged than the stand-alone single antenna CR terminal. In fact, features extracted, it is possible to minimize the channel the detection rate, reported in Table 2, increases for both impairments [16] at the cost of a slight increment of the architectures for the three considered classes of signal. It is control channel capacity (i.e., to accommodate redundant important to note that the main improvement is obtained data). Note that the smaller the exchanged information the for the detection of the IEEE 802.16e signal, which is often smaller is the quantity of redundant data for minimizing confused with the noise if a stand-alone single antenna the channel detrimental effects (and then the impact on the architecture is considered. In fact, these two classes can control channel capacity). For these reasons, the information be confused especially when the received signal is heavily reduction phase is proposed for the cooperative single corrupted by channel impairments (see Figure 4), and for antenna architecture allowing to consider reasonable the this reason spatial diversity of cooperative and multiple assumption of ideal channel. antenna systems allows to improve the performance. This The increment of the probability of correct detection is of particular importance in CR networks since when the is more significant for low values of Tobs and Eb /N0 . In transmitted signal of the primary user is classified as noise, particular, if the cooperative architectures is composed by a false opportunity is detected and consequently a potential n = 3 CR terminals with t = 1 and Eb /N0 = −5 dB, the harmful interference can arise. The same considerations can probability of correct detection increases of 0.1 with respect be done if an energy per bit to noise power spectral density ratio Eb /N0 = −5 dB, for all the values of Tobs , is considered, to the one obtained by the stand-alone single antenna CR terminal (with n = t = 1), as shown in Figure 6. A similar as reported in Table 3. behavior is obtained for the multiple antenna architecture, In order to investigate the capability of the proposed although, in this case, the improvement is less significant for architectures to avoid potential detrimental interference to the reasons previously explained. The proposed processing primary users, the probability of false opportunity detection Pfo , that is the probability to classify the received signal as chain for the cooperative and multiple antenna architectures well suited for practical CR networks (e.g., IEEE 802.22 [3]), noise given the presence of an IEEE 802.16e or an IEEE where CR terminals have to reliably detect the presence of the 802.11a signal, is reported in Figure 8 for the considered Eb /N0 by using all the values of Tobs . Although here not primary users even in low SNR environment by using a short reported, Pfo versus Tobs exhibits the same behavior. Note observation time. In particular, satisfactory correct detection that the probability of false opportunity detection Pfo is and classification rates are obtained for an observation time related to the probability of correct detection Pcorr as the of 2 (ms) as reported in Table 2 and in Figure 7. Note that to obtain this results all the considered Eb /N0 are used. probability of detection Pd is related to the probability of missed detection Pmd in classical binary hypothesis testing Table 2 represents the confusion matrix for the considered
- 14 EURASIP Journal on Wireless Communications and Networking Table 4: Comparison of the performances of the proposed 0.12 architectures. 0.1 (a) For Eb /N0 = −5 Pcorr Architecture Parameters 0.08 n=1 t=1 Stand-alone single antenna 0.8817 Pfo 0.06 n=3 t=1 0.9847 Cooperative n=5 t=1 0.9973 0.04 n=7 t=1 0.9983 n=1 t=3 0.9403 0.02 Multiple antenna n=1 t=5 0.9540 n=1 t=7 0 0.9673 −5 0 5 10 15 (b) For Tobs = 2 ms Eb /N0 (dB) Pcorr Architecture Parameters n = 1, t = 1 n = 3, t = 1 n = 1, t = 3 n = 5, t = 1 n=1 t=1 Stand-alone single antenna 0.9528 n = 1, t = 5 n = 7, t = 1 n=3 t=1 0.9928 n = 1, t = 7 Cooperative n=5 t=1 0.9979 n=7 t=1 0.9989 Figure 8: Probability of false opportunity detection Pfo versus energy per bit to noise power spectral density ratio Eb /N0 for n=1 t=3 0.9725 different numbers n of cooperative single antenna CR terminals and Multiple antenna n=1 t=5 0.9776 multiple antenna CR terminal with a variable number t of antennas. n=1 t=7 0.9797 problems [19]. In fact, Pfo decreases as Pcorr increases. More- mentation of the cooperative single antenna and multiple over, it can be verified graphically from Figures 6 and 8 that antenna architectures. For example, for an Eb /N0 = −5 dB Pfo + Pcorr ≈ 1 (the result is slightly lower than 1 due to those (considering all the values of the Tobs ), the cooperative single cases where the primary signal is detected but classified into antenna architecture composed by n = 3 terminals allows to a wrong signal standard, which is not accounted for by Pcorr ). increase Pcorr of about 0.1 with respect to the single antenna In general the performance of the proposed architectures architecture. increases as the Eb /N0 and Tobs increase, as expected. Moreover, Pfo decreases with the number n of cooperative 6.2. Influence of the Information Reduction Phase on the single antenna CR terminals and with the number t of Performances. As reported in Section 4.2, an information receiving antenna of the multiple antenna CR terminal. As reduction phase is carried out in order to reduce the amount an example, if the multiple antenna system is equipped with of data to be processed during the classification phase. On t = 5 antennas and Eb /N0 = −5 dB, the probability of false one hand, this reduction enables to shorten the classification opportunity detection decreases of 0.07 with respect to the time, and hence the entire computational time, allowing to one obtained by the stand-alone single antenna CR terminal perform opportunity detection and exploitation in real-time. (with n = t = 1), as shown in Figure 8. It is important to But on the other hand, an incorrect compression can enable a note that the probability of missed opportunity detection loss in the information used as input to the classifier leading Pmo , that is, the probability to classify the received signal to an undesirable drop of the performances. as an IEEE 802.16e or an IEEE 802.11a signals given the absence of transmission by the primary users, although here In order to evaluate the impact of the information not reported, exhibits the same behavior of the presented Pfo . reduction phase in terms of performances and complexity, Finally, a comparison of the performances of the pro- some numerical results are provided. For the sake of brevity, posed architectures is presented in Table 4 under specific the obtained performances are reported for the multiple evaluation conditions, that is, for low values of Eb /N0 antenna architectures, while some comments are provided and Tobs . It shows the probability of correct detection for both cooperative single antenna and multiple antenna Pcorr for the simulated values n of the cooperative single architectures. In particular, a single multiclass SVM classifier antenna CR terminals and the number t of the receiving has been designed for each number of receiving antenna by antennas of the multiple antenna CR terminal. Once again using as input the SCF profile provided by (3) and shown it is possible to state that the cooperative and multiple in Figure 4 or the extracted features provided by (4) and antenna architectures guarantee a significant improvement shown in Figure 5. Note that the dimension of the input to the multiclass SVM is (NSCF /β) − 1 = 79 real values in the of the performance with respect to traditional stand-alone case of the SCF profile and i = 2 real values (i.e., the number single antenna CR terminal, especially under the worst case conditions justifying the extra cost necessary for the imple- of extracted features) in the case of extracted features.
- EURASIP Journal on Wireless Communications and Networking 15 1 1 0.995 0.98 0.99 0.985 0.96 0.98 Pcorr 0.94 Pcorr 0.975 0.97 0.92 0.965 0.9 0.96 0.955 0.88 −5 0 5 10 15 0.95 0.002 0.003 0.004 0.005 0.006 0.007 0.008 0.009 0.01 Eb /N0 (dB) Tobs (s) n = 1, t = 3 n = 1, t = 1 n = 1, t = 1 n = 1, t = 3 n = 1, t = 5 n = 1, t = 3 n = 1, t = 3 n = 1, t = 5 n = 1, t = 5 n = 1, t = 5 Figure 9: Probability of correct detection Pcorr versus energy per bit Figure 10: Probability of correct detection Pcorr versus observation to noise power spectral density ratio Eb /N0 for different multiple time Tobs for different multiple antenna CR terminal with a variable antenna CR terminal with a variable number t of antennas for the number t of antennas for the extracted features (continuous lines) extracted features (continuous lines) and for the SCF profile (dotted and for the SCF profile (dotted lines). lines). The probability of correct detection Pcorr for the multiple COST 207—Bad Urban channel model, see Table 1). Table 4 antenna architecture is reported in Figures 9 and 10 for shows the performance of a cooperative architecture with different values of Eb /N0 and Tobs , respectively. different numbers n of single antenna terminals for Tobs = 3 ms, using all the considered values of Eb /N0 . It can be It can be deduced that if the SCF profile is used as noted that Pcorr decreases as the channel detrimental effects input to the classification phase then a slight improvement increase, as expected. Although the cooperative architecture of the performances is obtained with respect to the case shows a satisfactory performance, AMC techniques can be in which the extracted features are used. The benefit is used to mitigate the channel impairments allowing to further greater for low values of Eb /N0 and Tobs . As an example, improve the performances at the cost of an increased control Pcorr increases of about 0.03 if the SCF profile is used as input to the classifier and Eb /N0 = −5 dB, for a multiple channel capacity. Finally, note that for a multiple antenna architecture the antenna architecture equipped with 3 or 5 antennas. Note information reduction phase is not crucial as for cooperative that the same conclusion can be drawn if the cooperative single antenna architecture. In fact, multiple antenna does single antenna architecture is considered. However, this not require a dedicated control channel and hence a higher improvement is obtained at the cost of an increased elapsed dimension of the input to the classifier can be accepted time for the testing phase. Table 5(a) shows the CPU time for leading to an improvement of the performances (as shown testing a single input by using the multiclass SVM classifier in Figures 10 and 9). However, this improvement is obtained for various values of n and t . The reported data refers to an at the cost of an increased elapsed time for the testing phase Intel Pentium Core 2 CPU working at 1.86 GHz; the code was which can be undesirable in practical scenarios. implemented in C++. It can be deduced that testing an SCF profile requires at least twice the time required to test a set of extracted features for all the considered architectures. 6.3. Discussion on the Elapsed Time for Processing and Moreover, if the cooperative single antenna architec- Classification Phases. As far as the computational complexity ture is considered, an increased control channel capacity of the proposed processing chain is concerned, the CPU time is required to support the SCF profile exchange. Note for the SCF estimation of the considered signals is reported that such a channel cannot be available in practical CR in Table 5(b), while the CPU time for testing a single input by scenarios and hence a further information reduction step using the multiclass SVM classifier is reported in Table 5(a) for various values of n and t . The reported data refers to an (i.e., features extraction) could be required. Furthermore, in practical scenarios the exchanged information can be Intel Pentium Core 2 CPU working at 1.86 GHz; the code was affected by channel impairments which can negatively affect implemented in C++. the performances (Table 6). In order to evaluate these effects, It is important to note that the elapsed time for SCF estimation increases as Tobs increases, while the elapsed time it is supposed that the cooperative single antenna terminals for testing a single set of features increases as the number n of share the local extracted features by using a control channel affected by AWGN and multipath distortions (i.e., using the cooperative CR terminals increases. In fact, the dimension of
- 16 EURASIP Journal on Wireless Communications and Networking Table 6: Effects of channel impairments on the exchanged infor- Table 5: computational complexity of the proposed processing chain. mation. Pcorr Parameters Control channel (a) Elapsed time for testing a single input n=3 t=1 Ideal 0.9952 CPU time Parameters Architecture Input type n=3 t=1 Multipath SNR = 15 dB 0.9715 (s) Multipath SNR = 0 dB n=3 t=1 0.9114 n=1 t=1 Single SCF profile 0.006 n=5 t=1 antenna Ideal 0.9994 n=1 t=1 Extracted features 0.003 Multipath SNR = 15 dB n=5 t=1 0.9875 n=1 t=3 SCF profile 0.006 Multipath SNR = 0 dB n=5 t=1 0.9456 n=1 t=5 Multiple SCF profile 0.006 antenna n=1 t=3 Extracted features 0.003 n=1 t=5 increase. As a general consideration, the total amount of the Extracted features 0.003 needed processing capabilities Ptot is similar in both cases n=3 t=1 SCF profile 0.010 although distributed in a different way between Pterminal and n=5 t=1 SCF profile 0.016 Cooperative Pfusion . However, if the cooperative architecture is considered, n=3 t=1 Extracted features 0.004 then it is usually preferable to increase Pterminal , performing n=5 t=1 the information reduction step, in order to limit the control Extracted features 0.006 channel capacity required. (b) CPU time for SCF evaluation Tobs (ms) CPU time (s) 7. Conclusions 2 0.52 In this paper, three architectures, that is, stand-alone single 3 0.75 antenna, cooperative and multiple antennas, have been pro- 5 1.25 posed for spectrum sensing. These architectures implement 10 2.54 the same advanced signal processing algorithm, based on a cyclostationary analysis which exploits a single SCF estimator and an algorithm to reduce the amount of data given on the set of features Υ increases with n, as can be easily deduced input to a multiclass SVM classifier for signal detection from (11). and classification. Numerical simulations have been carried Despite the fact that the implemented code is not out in a scenario where primary users can adopt IEEE optimized and a general purpose PC has been used for the 802.16e and IEEE 802.11a as transmission standards. This simulations, the evaluation of the SCF and the testing of a set scenario is challenging since both technologies implement a of features are relatively fast. If a specific purpose processor physical layer based on the OFDM technique, with the same and optimized code are developed, then even a real-time bandwidth and frequency band, and the received signals are corrupted by heavy multipath effects. Although the complex- detection could be possible. Note that the optimization of the code for the SCF estimation is out of scope of ity of the considered scenario, the proposed algorithm shows the present paper. However, the SCF estimator is based satisfactory performances even if applied to a single antenna on the DFT. It is well known that this transform can be terminal architecture. Moreover, the obtained performances efficiently implemented by using FFT algorithm allowing can be further improved if the cooperative and the multiple to significantly speed up the execution time making it antenna architectures are implemented. In particular, the applicable to real-time applications even with traditional probability of correct detection increases as the number hardware [48]. of cooperative terminals or the number of the receiving Finally, it is important to note that the elapsed time antennas of the multiple antenna architecture increase. for processing and classification phases is related to the Moreover, the probability of false opportunity detection and processing capabilities needed for each considered architec- the probability of missed opportunity detection decrease as ture (see Section 5). In particular, let us suppose that an the number of cooperative terminals and the number of information reduction step is carried out and the extracted the receiving antennas of the multiple antenna architecture features are used as input to the classification phase. In this increase. This is of fundamental importance in CR networks where the efficient use of the radio spectrum is the main tar- case, the processing capabilities at the terminals Pterminal are greater than the ones needed when information reduction get. These improvements of the performances are obtained at is not considered, while the processing capabilities at the the price of a rise in hardware costs due to several receiving fusion center Pfusion decrease since it has to manage the antennas in the case of multiple antenna architecture or an extracted features (i.e., a few bits) instead of a higher increment of the overhead due to the presence of a control amount of information (see Section 4.2). On the contrary, channel if the cooperative architecture is employed. Finally, if the information reduction step is not carried out, then it is important to remark that cooperative and multiple the processing capabilities at the terminals Pterminal decrease antenna architectures allow to shorten the observation time while the processing capabilities at the fusion center Pfusion and to improve the overall sensitivity.
- EURASIP Journal on Wireless Communications and Networking 17 References [18] W. C. Y. Lee, Mobile Communications Engineering: Theory and Applications, McGraw-Hill, New York, NY, USA, 2nd edition, [1] S. Haykin, “Cognitive radio: brain-empowered wireless com- 1997. munications,” IEEE Journal on Selected Areas in Communica- [19] P. K. Varshney, Distributed Detection and Data Fusion, tions, vol. 23, no. 2, pp. 201–220, 2005. Springer, New York, NY, USA, 1st edition, 1996. [2] M. Gandetto and C. Regazzoni, “Spectrum sensing: a dis- [20] H. Urkowitz, “Energy Detection of unknown deterministic tributed approach for cognitive terminals,” IEEE Journal on signals,” Proceedings of IEEE, vol. 55, pp. 523–531, 1967. Selected Areas in Communications, vol. 25, no. 3, Article ID [21] L. Bixio, M. Ottonello, M. Raffetto, and C. S. Regazzoni, 4155370, pp. 546–557, 2007. “Performance evaluation of a multiple antenna system for [3] I. F. Akyildiz, W. Y. Lee, M. C. Vuran, and S. Mohanty, “NeXt spectrum sensing,” in Proceedings of the IEEE International generation/dynamic spectrum access/cognitive radio wireless Symposium on Antennas and Propagation, North Charleston, networks: a survey,” Computer Networks, vol. 50, no. 13, pp. SC, USA, June 2009. 2127–2159, 2006. [22] R. Hachemani, J. Palicot, and C. Moy, “A new standard [4] B. Farhang-Boroujeny and R. Kempter, “Multicarrier commu- recognition sensor for cognitive terminal,” in Proceeding of the nication techniques for spectrum sensing and communication European Signal Processing Conference, 2007. in cognitive radios,” IEEE Communications Magazine, vol. 46, [23] K. Ahmad, U. Meier, and H. Kwasnicka, “Fuzzy logic based no. 4, pp. 80–85, 2008. signal classification with cognitive radios for standard wireless [5] T. A. Weiss and F. K. Jondral, “Spectrum pooling: an innova- technologies,” in Proceedings of the 5th International Con- tive strategy for the enhancement of spectrum efficiency,” IEEE ference on Cognitive Radio Oriented Wireless Networks and Communications Magazine, vol. 42, no. 3, pp. S8–S14, 2004. Communications (CROWNCom ’10), pp. 1–5, Cannes, France, [6] T. Y¨ cek and H. Arslan, “A survey of spectrum sensing u June 2010. algorithms for cognitive radio applications,” IEEE Communi- [24] V. Chen and H. Ling, “Joint time-frequency analysis,” IEEE cations Surveys and Tutorials, vol. 11, no. 1, pp. 116–130, 2009. Signal Processing Magazine, vol. 16, no. 2, pp. 52–67, 1999. [7] W. A. Gardner, “Signal interception: a unifying theoretical ¨ [25] M. Oner and F. Jondral, “On the extraction of the channel framework for feature detection,” IEEE Transactions on Com- allocation information in spectrum pooling systems,” IEEE munications, vol. 36, no. 8, pp. 897–906, 1988. Journal on Selected Areas in Communications, vol. 25, no. 3, pp. [8] E. Azzouz and A. Nandi, Automatic Modulation Recognition 558–565, 2007. of Communication Signals, Kluwer Academic, Norwell, Mass, [26] A. Fehske, J. Gaeddert, and J. H. Reed, “A new approach USA, 1996. to signal classification using spectral correlation and neural [9] C. K. Chen and W. A. Gardner, “Signal-selective time- networks,” in Proceedings of the 1st IEEE International Sympo- difference of arrival estimation for passive location of man- sium on New Frontiers in Dynamic Spectrum Access Networks made signal sources in highly corruptive environments–II: (DySPAN ’05), pp. 144–150, Baltimore, Md, USA, November algorithms and performance,” IEEE Transactions on Signal 2005. Processing, vol. 40, no. 5, pp. 1185–1197, 1992. [27] K. Kim, I. A. Akbar, K. K. Bae, J. -S. Um, C. M. Spooner, and [10] D. Cabric, S. M. Mishra, and R. W. Brodersen, “Implemen- J. H. Reed, “Cyclostationary approaches to signal detection tation issues in spectrum sensing for cognitive radios,” in and classification in cognitive radio,” in Proceedings of the 2nd Proceedings of the Conference Record of the 38th Asilomar IEEE International Symposium on New Frontiers in Dynamic Conference on Signals, Systems and Computers, pp. 772–776, Spectrum Access Networks, pp. 212–215, Dublin, Ireland, April November 2004. 2007. [11] P. D. Sutton, K. E. Nolan, and L. E. Doyle, “Cyclostationary [28] L. Bixio, A. F. Cattoni, C. S. Regazzoni, and P. K. Varsh- signatures in practical cognitive radio applications,” IEEE ney, “Autonomic computing and networking,” in Embodied Journal on Selected Areas in Communications, vol. 26, no. 1, pp. Cognition-Based Distributed Spectrum Sensing for Autonomic 13–24, 2008. Wireless Systems, Springer, New York, NY, USA, 2009. [12] S. Geirhofer, L. Tong, and B. M. Sadler, “Dynamic spectrum [29] B. A. Fette, Cognitive Radio Technology, Newnes, Oxford, UK, access in the time domain: modeling and exploiting white 2006. space,” IEEE Communications Magazine, vol. 45, no. 5, pp. 66– [30] A. K. Jain, R. P. W. Duin, and J. Mao, “Statistical pattern 72, 2007. recognition: a review,” IEEE Transactions on Pattern Analysis [13] R. Chen, J. M. Park, Y. T. Hou, and J. H. Reed, “Toward secure and Machine Intelligence, vol. 22, no. 1, pp. 4–37, 2000. distributed spectrum sensing in cognitive radio networks,” [31] R. P. Lippmann, “Pattern classification using neural networks,” IEEE Communications Magazine, vol. 46, no. 4, pp. 50–55, IEEE Communications Magazine, vol. 27, no. 11, pp. 47–59, 2008. 1989. [14] A. Ghasemi and E. S. Sousa, “Spectrum sensing in cognitive [32] B. Ramkumar, “Automatic modulation classification for cog- radio networks: requirements, challenges and design trade- offs,” IEEE Communications Magazine, vol. 46, no. 4, pp. 32– nitive radios using cyclic feature detection,” IEEE Circuits and Systems Magazine, vol. 9, no. 2, pp. 27–45, 2009. 39, 2008. [15] S. Bellofiore, C. A. Balanis, J. Foutz, and A. S. Spanias, “Smart- [33] L. Bixio, G. Oliveri, M. Ottonello, and C. S. Regazzoni, antenna systems for mobile communication networks. Part 1: “OFDM recognition based on cyclostationary analysis in an overview and antenna design,” IEEE Antennas and Propagation open spectrum scenario,” in Proceeings of the IEEE 69th Magazine, vol. 44, no. 3, pp. 145–154, 2002. Vehicular Technology Conference (VTC ’09), Barcelona, Spain, April 2009. [16] A. Goldsmith, Wireless Communications, Cambridge Univer- sity Press, Cambridge, UK, 1st edition, 2005. [34] V. Kecman, Learning and Soft Computing: Support Vector [17] T. S. Rappaport, Wireless Communications: principles and Machines, Neural Networks, and Fuzzy Logic Models, MIT Practice, Prentice Hall, New York, NY, USA, 2nd edition, 2002. Press, Cambridge, Mass, USA, 2001.
- 18 EURASIP Journal on Wireless Communications and Networking [35] S. Gunn, “Support vector machine for classification and regression,” Tech. Rep., University of Southampton, South- ampton, UK, 1988. [36] C.-C. Chang and C.-J. Lin, “LIBSVM: a library for support vector machines,” 2001, http://www.csie.ntu.edu.tw/∼cjlin/ libsvm/. [37] C. W. Hsu, C. C. Chang, and C. J. Lin, “A practical guide to support vector classification,” Tech. Rep. 106, Department Of Computer Science National Taiwan University, Taipei, Taiwan, 2008. [38] C. Bishop, Pattern Recognition and Machine Learning, Springer, New York, NY, USA, 2006. [39] L. Bixio, G. Oliveri, M. Ottonello, M. Raffetto, and C. S. Regaz- zoni, “Cognitive radios with multiple antennas exploiting spatial opportunities,” IEEE Transactions on Signal Processing, vol. 58, no. 8, pp. 4453–4459, 2010. [40] L. Bixio, M. Ottonello, M. Raffetto, C. S. Regazzoni, and C. Armani, “A comparison among cooperative spectrum sensing approaches for cognitive radios,” in Proceedings of the 2nd International Workshop on Cognitive Information Processing (CIP ’10), pp. 168–173, Elba Island, Italy, June 2010. [41] L. Bixio, M. Ottonello, H. Sallam, M. Raffetto, and C. S. Regazzoni, “Signal classification based on spectral redundancy and neural network ensembles,” in Proceedings of the 4th International Conference on Cognitive Radio Oriented Wireless Networks and Communications (CROWNCOM ’09), Han- nover, Germany, June 2009. [42] L. Bixio, M. Ottonello, M. Raffetto, and C. S. Regazzoni, “A comparison between stand-alone and distributed archi- tectures for spectrum hole detection,” in Proceedings of the IEEE Wireless Communications and Networking Conference (WCNC ’10), April 2010. [43] H. Ishii and G. W. Wornell, “OFDM blind parameter iden- tification in cognitive radios,” in Proceedings of the IEEE 16th International Symposium on Personal, Indoor and Mobile Radio Communications (PIMRC ’05), pp. 700–705, September 2005. [44] IEEE 802.16-2005, “IEEE standard for local and metropolitan Area Network Part 16: Air Interface for Fixed Broadband Wireless Access System Amendament 2: Physical and Medium Access Control Layer for Combined Fixed and Mobile Opera- tions in Licensed Bands,” December 2005. [45] IEEE 802.11-1999, “IEEE standard for local and metropolitan Area Network Part 11: Wireless LAN Medium Access Control (MAC) andPhysical Layer (PHY) specifications High-speed Physical Layer in the 5 GHz Band,” 1999. [46] M. Patzold, Mobile Fading Channels, John Wiley & Sons, New York, NY, USA, 2002. [47] M. Gandetto, M. Guainazzo, and C. S. Regazzoni, “Use of time-frequency analysis and neural networks for mode identification in a wireless software-defined radio approach,” Eurasip Journal on Applied Signal Processing, vol. 2004, no. 12, pp. 1778–1790, 2004. [48] X. -F. Li, C. Long, and W. Shihu, “The implementation of high-speed FFT processor based on FPGA,” in Proceedings of the International Conference on Computer, Mechatronics, Control and Electronic Engineering (CMCE ’10), vol. 2, pp. 236–239, Changchun, China, August 2010.
CÓ THỂ BẠN MUỐN DOWNLOAD

-

Báo cáo hóa học: " Review Article MIMO Technologies in 3GPP LTE and LTE-Advanced"
 10 p |
  79
|
79
|  19
19
-

Báo cáo hóa học: " Review on solving the inverse problem in EEG source analysis"
33 p | 47
| 9
-

báo cáo hóa học: " Review on solving the forward problem in EEG source analysis"
29 p | 51
| 9
-
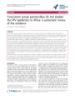
báo cáo hóa học:" Concurrent sexual partnerships do not explain the HIV epidemics in Africa: a systematic review of the evidence"
23 p | 55
| 8
-

Báo cáo hóa học: "Review Article A Model-Driven Approach for Hybrid Power Estimation in Embedded Systems Design"
15 p | 49
| 8
-

Báo cáo hóa học: " Review Article AVS-M Audio: Algorithm and Implementation"
16 p | 50
| 8
-

Báo cáo hóa học: "Review Article Techniques to Obtain Good Resolution and Concentrated Time-Frequency Distributions: A Review"
43 p | 47
| 7
-

Báo cáo hóa học: " Review Article Do All Integrable Equations Satisfy Integrability Criteria?"
16 p | 47
| 7
-
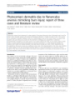
Báo cáo hóa học: " Phytocontact dermatitis due to Ranunculus arvensis mimicking burn injury: report of three cases and literature review"
5 p | 57
| 6
-

Báo cáo hóa học: " Review Article An Overview on Wavelets in Source Coding, Communications, and Networks"
27 p | 54
| 6
-

Báo cáo hóa học: " Review Article q-Genocchi Numbers and Polynomials Associated with q-Genocchi-Type l-Functions"
12 p | 63
| 6
-
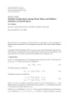
Báo cáo hóa học: " Review Article Remarks of Equivalence among Picard, Mann, and Ishikawa Iterations in Normed Spaces Xue Zhiqun"
5 p | 47
| 5
-
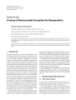
Báo cáo hóa học: " Review Article A Survey of Homomorphic Encryption for Nonspecialists"
10 p | 44
| 5
-

Báo cáo hóa học: " Research Article A Review of Signal Subspace Speech Enhancement and Its Application to Noise Robust Speech Recognition
15 p | 57
| 5
-
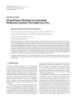
Báo cáo hóa học: " Review Article Bit and Power Allocation in Constrained Multicarrier Systems: The Single-User Case"
14 p | 55
| 4
-

báo cáo hóa học:" Role of CA125 in predicting ovarian cancer survival - a review of the epidemiological literature"
20 p | 42
| 4
-

Báo cáo hóa học: " Rehabilitation of gait after stroke: a review towards a top-down approach."
42 p | 41
| 4


Chịu trách nhiệm nội dung:
Nguyễn Công Hà - Giám đốc Công ty TNHH TÀI LIỆU TRỰC TUYẾN VI NA
LIÊN HỆ
Địa chỉ: P402, 54A Nơ Trang Long, Phường 14, Q.Bình Thạnh, TP.HCM
Hotline: 093 303 0098
Email: support@tailieu.vn
Giấy phép Mạng Xã Hội số: 670/GP-BTTTT cấp ngày 30/11/2015 Copyright © 2022-2032 TaiLieu.VN. All rights reserved.

